Markets and Macro Quarterly · Current issue
Markets and Macro Quarterly, October 2026
October 2026 · Quarterly analysis of economic and financial time series
- Issue
- October 2026 (data through 2026-10-31)
- Authors
- Scott Sykowski and the Gyre Product Research Team
- Contact
- team@gyreresearch.com
- Check any pair
- gyreresearch.com/covariance (free calculator)
- Published
Free to read and share: each issue is published under CC BY 4.0. Not investment advice.
In brief
- US stocks no longer tell you what Tokyo will do next morning. When US energy stocks rose during the New York day, Japan's Nikkei 225 tended to rise at the next open; over the last 12 months that link fell from +0.42 to −0.06, the largest 12-month drop on record. Section 4.4
- A “safe” part of the stock market has been behaving like a bond. Consumer Staples shares have been falling when interest rates rise, more sharply than in 99% of their history since 1999; part of this is a more volatile market rather than a lasting change. Section 4.2
- Treasuries stopped cushioning stock falls. Since the Fed began raising rates in 2022, the S&P 500 and the 10-year yield went from moving clearly together (+0.36) to about no relation (−0.10), so falling stocks no longer bring rising bond prices. Section 4.7
- Bonds and foreign holdings now tend to lose at the same time. Rising US rates now come with a stronger dollar (−0.08 before, +0.31 since 2021), so when rates jump, bonds fall and the stronger dollar shrinks the value of unhedged foreign holdings. Section 4.7
- Real estate stocks now track mortgage rates far more closely. The link went from weak (−0.11 to 2020) to strong (−0.62 in 2021–23, −0.51 since). Section 4.8
- Expected, not found: a turning point at the pandemic. The data date the stock-bond turn to 1 April 2022 and the rate-dollar turn to 30 March 2022, when the Fed began raising rates. Section 4.7
- Expected, not found: economic data that warns ahead of US stock moves. None of the indicators tested leads US stocks once clustered calm and stormy spells are allowed for; across the study, 1,280 of 1,956 findings of the ordinary test no longer held. Section 4.9
- Expected, not found: energy as an early signal. Of 23 energy leads tested, only one kind held: the price of oil gives about two months' notice of the next US consumer price figure. Section 4.3
- Expected, not found: relationships breaking in a turbulent year. Over the last 1, 3 and 6 months nothing moved outside its own history by more than chance alone would produce (139 flags against 119 by chance). Section 4.2
- Explore your own ideas for free: every relation in this paper, and any pair of your own, can be measured in Gyre's free Covariance Calculator at gyreresearch.com/covariance.
Work with Gyre
The Gyre Investment Analytics Hub is inexpensive and sits on top of your current OMS, EMS and accounting systems, dramatically enhancing decision support and analysis. Gyre also provides custom analytics to meet any proprietary need. Contact us today: team@gyreresearch.com
team@gyreresearch.comIntroductionWhat this analysis is, and what it is not
What it is
- A study of how 183 economic and market series move together: 45 daily market series (the S&P 500 and its sectors, interest rates, currencies, commodities, volatility and stock indexes abroad), 3 weekly series (jobless claims, the 30-year mortgage rate and financial conditions) and 135 monthly and quarterly economic series from the US and other large economies, from 1999 to 31 October 2026.
- It asks four questions: which series move together most and least; which relationships have changed, recently or since 2020; which series move first and give notice of another; and which readings are unusual today.
- The method was written down before any result was computed, and every finding is tested against what chance alone would produce, with tests that allow for the way financial data clusters in calm and stormy spells.
- Every relationship in it can be checked, and any pair of your own explored, in Gyre's free Covariance Calculator at gyreresearch.com/covariance.
What it is not
- Not investment advice, and not a recommendation to buy or sell anything.
- Not a test of a trading strategy: it measures relationships, not profits after costs. Testing whether an unusual gap between two stocks is worth betting on is the job of Pairs-Trade Analysis, in preparation.
- Not an explanation of causes: two series moving together does not mean one drives the other.
- Not a forecast: relationships change, and this issue shows several that did. A relationship that held for twenty years can stop.
- Not a model of the whole economy: it covers these series only. Section 5 sets out what the data cannot tell you.
Section 1Why covariance matters in finance
- Risk is a matrix, not a list. A portfolio's variance is the sum of every holding's variance and every pair's covariance. With 20 holdings there are 20 variances and 190 covariances: most of the risk is in the pairs.
- Diversification only works between assets that do not move together. Two assets with correlation 0.9 add little protection; a correlation near zero or below adds a lot.
- Hedges are covariances. A hedge ratio is a beta: the covariance of the position with the hedge divided by the hedge's variance.
- Relations change, and they change fastest when it matters. Correlations between risky assets tend to rise in sell-offs, just when diversification is needed. Some of that rise is mechanical (higher volatility alone raises a measured correlation); some is real.
- Macro data arrives late and is revised. A relation between a market and an economic release is only usable from the day the figure is published, and at the value first published.
1.1 How a lead works
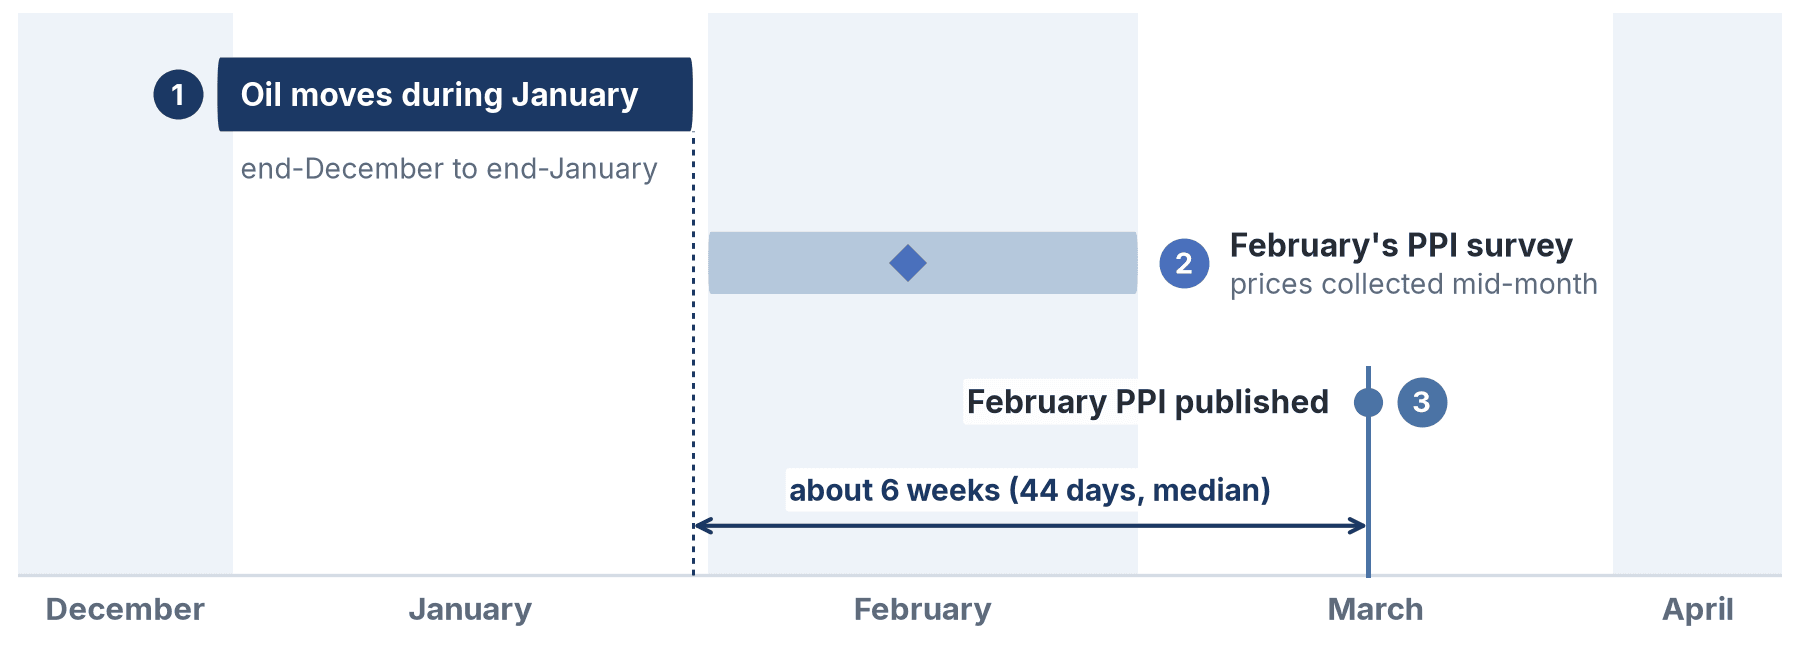
- A lead is measured against the release, not the month described. Oil's change in January is set against the producer price index released in March, which describes February: a lag of 2 release months is a lead of 1 month of the period described.
- The usable time is to publication. From the end of the oil month to the release is 44 days at the median (331 releases since 1999): about 6 weeks.
Section 2How to use the calculator
Open the free calculator at gyreresearch.com/covariance: no sign-in, any two series, any frequency.
- Pick two series: a stock or ETF by ticker or name, or one of more than 850,000 FRED economic series.
- Pick a frequency (daily to annual) and a look-back. The menu offers only the look-backs both series can fill; security prices start 2023-12-01, FRED series reach back decades.
- The calculator measures each series the standard way by default: percent change for prices and quantities, change in level for rates and other series in percent.
- Read the result: the covariance (in the two series' units), the correlation (-1 to 1), R squared, and both betas, with their standard error when there are fewer than 30 observations, and notes on anything that limits the reading (a shortened window, series measured at different times of day, levels that trend).
2.1 The analyst: is the story in the data?
- Test a macro thesis before writing it. "Rising real yields hurt technology stocks": pick DFII10 and a technology stock or sector fund, weekly or monthly, 5 to 10 years. The correlation says whether the relation exists; the beta says how large it is; the window says whether it is recent or long-standing.
- Find what a company really moves with. A stock against oil, the dollar, the 10-year yield and credit spreads in turn: the strongest is its true macro driver, which is not always its sector label.
- Check that a relation is not two trends. Run it on changes (the default), never on levels: two rising series always look related as levels.
- Cite it. Every result names its data source; a pair, frequency and window can be shared as a link and reproduced by anyone.
2.2 The portfolio manager: what does the book really hold?
- Diversification check before adding a position. The correlation of the candidate with the portfolio's largest exposure (or with SPY): near 1 adds concentration, near 0 or below adds diversification.
- Hidden factor exposure. Each holding against the 10-year yield, the dollar, oil or credit spreads: several holdings with large betas to the same series are one bet, whatever their sectors.
- Stress view. The same pair over a calm and a volatile window (for example 2024 against 2020): correlations usually rise in sell-offs, so the diversification that shows in calm data is the most a book can count on, not the least.
- Benchmark fit. A fund or ETF held in the book against its benchmark (for example a sector fund against SPY): the beta is the market exposure it actually carries, the R squared how much of its movement the market explains.
2.3 The trader: what has changed, and how much to hedge
- Hedge ratio. The beta of the position on its hedge instrument, over a look-back that matches the holding period (1 to 3 months for a short-term trade); size the hedge as position value times beta.
- Relative-value pairs. Two related names (KO and PEP, XOM and CVX): the correlation says whether the pair is still a pair; the beta gives the ratio to trade them in.
- Regime check. The same pair over 1 month, 3 months and 1 year: a short-window reading far from the long one is the kind of aberration this paper tests for, and the first sign that a hedge or a pair has stopped working.
- Macro event read. A sector against the series behind the next release (payrolls, CPI, claims), monthly, to see how strongly the sector has moved with that figure.
Section 3The study: data and method
3.1 Data
- Markets, daily (45 series): the S&P 500 and its 11 sectors, each rebuilt cap-weighted from each day's index members and weights (1999 to now); US Treasury yields from 3 months to 30 years, the 10y-2y and 10y-3m curves, the 10-year real yield, breakeven inflation, the 5y5y forward inflation rate, the 10-year term premium, the Baa credit spread; VIX, oil and gold volatility, economic policy uncertainty; the broad dollar and 11 currencies; WTI, Brent, natural gas; the Nikkei 225, Bitcoin and Ether.
- Macro, monthly (108 series): for the US, euro area, Germany, France, Italy, the UK, Japan, Canada, China, India and Brazil, every indicator of growth, inflation, employment, confidence, rates, credit, trade and markets that FRED publishes monthly and current; global food, energy and metal prices.
- Quarterly, long history only (30 series): real GDP, fixed investment, house prices, US government debt to GDP.
- All economic data from FRED, only series it marks free to publish (Source: FRED, Federal Reserve Bank of St. Louis; each series' own source in Appendix A); sector returns calculated by Gyre Research.
3.2 Method (fixed before any result)
- Measurement: daily changes for markets; monthly changes for macro; release-dated, first-published values for every lead and lag test, each change taken within the release that first published it.
- Windows: two baselines (the pair's whole history; the last 12 months, 252 trading days) and three recent windows (6 months, 3 months, 1 month).
- Two correlations: Pearson and Spearman (rank); a finding counts only when both agree.
- Aberration: today's reading beyond the pair's own 1st or 99th percentile of the same measurement in its history; tested again within periods of similar volatility.
- Leads and lags: each series' own momentum removed first; a lead counts only if it passes a false-discovery test in 1999–2020 (or the pair's first common month to 2020) and is confirmed again in 2021–2026, years not used to find it.
- Discovery periods differ by pair: the monthly test starts at each pair's first common month, as pre-registered.
- Significance, honestly measured: market changes cluster in calm and stormy spells, and macro changes stay autocorrelated, so the ordinary correlation test finds too much. Every p-value here allows for both (a Newey-West test); a finding is also checked against a stricter multiple-testing rule valid under any dependence (Benjamini-Yekutieli), a bootstrap interval of its correlation, and, for three families, a family-wide check (Romano-Wolf). Section 4.9 shows what this changed.
- Chance: every result states how many findings chance alone would produce.
- Checked: 24 pairs equal the public calculator's figures and 6 pairs equal a hand calculation from FRED's own download (section 4.6).
Section 4Results
4.1 Strongest and weakest
A ranking, not a test: the 20 largest and the 20 closest to zero of 990 market pairs, on the last 252 trading days, Pearson and Spearman of the same sign.
| # | Pair | r | Rank r | Days | Built from the other (reading) |
|---|---|---|---|---|---|
| 1 | 10-year Treasury yield / 10-year term premium (model) | +0.95 | +0.94 | 1 | term premium is a model of yields |
| 2 | 10-year Treasury yield / 30-year Treasury yield | +0.92 | +0.92 | 1 | |
| 3 | Broad dollar index / USD per euro | −0.92 | −0.88 | 1 | the dollar index includes it |
| 4 | Bitcoin / Ether | +0.90 | +0.91 | 1 | |
| 5 | 10-year Treasury yield / 10-year real yield | +0.90 | +0.89 | 1 | nominal and real 10-year |
| 6 | 10-year real yield / 10-year term premium (model) | +0.88 | +0.87 | 1 | term premium is a model of yields |
| 7 | 30-year Treasury yield / 10y-3m curve | +0.86 | +0.86 | 1 | |
| 8 | 10-year Treasury yield / 10y-3m curve | +0.86 | +0.85 | 1 | one is a spread of the other |
| 9 | 30-year Treasury yield / 10-year term premium (model) | +0.86 | +0.85 | 1 | term premium is a model of yields |
| 10 | USD per euro / Swiss franc per USD | −0.86 | −0.83 | 1 | |
| 11 | S&P 500 / Information Technology | +0.86 | +0.83 | 1 | the sector is in the index |
| 12 | Broad dollar index / USD per pound | −0.84 | −0.80 | 1 | the dollar index includes it |
| 13 | S&P 500 / VIX | −0.84 | −0.81 | 1 | |
| 14 | 10y-3m curve / 10-year term premium (model) | +0.83 | +0.82 | 1 | term premium is a model of yields |
| 15 | 30-year Treasury yield / 10-year real yield | +0.83 | +0.82 | 1 | |
| 16 | 2-year Treasury yield / 10-year term premium (model) | +0.83 | +0.81 | 1 | term premium is a model of yields |
| 17 | Broad dollar index / peso per USD | +0.82 | +0.80 | 1 | the dollar index includes it |
| 18 | USD per euro / USD per pound | +0.82 | +0.79 | 1 | |
| 19 | Broad dollar index / USD per Australian dollar | −0.82 | −0.79 | 1 | the dollar index includes it |
| 20 | 2-year Treasury yield / 10-year Treasury yield | +0.81 | +0.79 | 1 |
| # | Pair | r | Rank r | Days |
|---|---|---|---|---|
| 1 | Gold volatility / won per USD | −0.00 | −0.05 | 2 |
| 2 | Economic policy uncertainty (model) / yen per USD | −0.00 | −0.00 | 2 |
| 3 | Baa credit spread / rupee per USD | −0.00 | −0.03 | 2 |
| 4 | 10y-3m curve / Nikkei 225 | +0.00 | +0.02 | 2 |
| 5 | 5y5y forward inflation / Economic policy uncertainty (model) | −0.00 | −0.12 | 2 |
| 6 | Real Estate / 10y-2y curve | −0.00 | −0.02 | 2 |
| 7 | Health Care / US natural gas | +0.01 | +0.05 | 2 |
| 8 | 2-year Treasury yield / Nikkei 225 | +0.01 | +0.00 | 2 |
| 9 | rupee per USD / Bitcoin | −0.01 | −0.05 | 2 |
| 10 | Consumer Staples / yen per USD | −0.01 | −0.08 | 2 |
| 11 | Communication Services / Consumer Staples | +0.01 | +0.02 | 1 |
| 12 | VIX / US natural gas | +0.01 | +0.18 | 2 |
| 13 | 10y-2y curve / WTI crude oil | +0.01 | +0.04 | 1 |
| 14 | Communication Services / Economic policy uncertainty (model) | −0.01 | −0.04 | 2 |
| 15 | US natural gas / Nikkei 225 | +0.01 | +0.01 | 2 |
| 16 | Communication Services / 10y-2y curve | +0.01 | +0.03 | 2 |
| 17 | 3-month Treasury yield / 5y5y forward inflation | +0.01 | +0.02 | 1 |
| 18 | Utilities / Gold volatility | −0.01 | −0.01 | 1 |
| 19 | 10y-3m curve / Bitcoin | +0.01 | +0.03 | 2 |
| 20 | 10-year term premium (model) / Nikkei 225 | −0.01 | −0.01 | 2 |
| Pair | Groups | r | Rank r |
|---|---|---|---|
| S&P 500 / VIX | US equities / Volatility | −0.84 | −0.81 |
| Information Technology / VIX | US equities / Volatility | −0.70 | −0.64 |
| Consumer Discretionary / VIX | US equities / Volatility | −0.66 | −0.69 |
| Energy / Brent crude oil | US equities / Commodities | +0.58 | +0.60 |
| S&P 500 / USD per Australian dollar | US equities / Currencies | +0.58 | +0.56 |
| Energy / WTI crude oil | US equities / Commodities | +0.57 | +0.62 |
| Industrials / VIX | US equities / Volatility | −0.57 | −0.54 |
| Oil volatility / WTI crude oil | Volatility / Commodities | +0.55 | +0.49 |
| Oil volatility / Brent crude oil | Volatility / Commodities | +0.52 | +0.47 |
| 10-year breakeven inflation / Brent crude oil | Rates and credit / Commodities | +0.51 | +0.45 |
| Information Technology / USD per Australian dollar | US equities / Currencies | +0.51 | +0.49 |
| VIX / USD per Australian dollar | Volatility / Currencies | −0.49 | −0.47 |
4.2 Recent aberrations
Chance: 139 single flags against 118.8 from chance alone (5,940 tests × 2%). Strict (both baselines, at least two windows): 0.
| Window | Measured against | Pairs | Flags | Volatility-explained | Strict |
|---|---|---|---|---|---|
| 21 days | its own history | 990 | 19 | 5 | 0 |
| 21 days | gap to its 12-month value | 990 | 31 | 4 | 0 |
| 63 days | its own history | 990 | 23 | 7 | 0 |
| 63 days | gap to its 12-month value | 990 | 13 | 1 | 0 |
| 126 days | its own history | 990 | 50 | 18 | 0 |
| 126 days | gap to its 12-month value | 990 | 3 | 1 | 0 |
Descriptive: the Consumer Staples sector against rates. 8 of the flags are Consumer Staples against rate series, every one below the pair's own 1st percentile: staples moved against rates more strongly than in 99% of their own history in these windows. Not strict, so not a finding.
| Rate series | Window | Now | 1st to 99th percentile | Explained by |
|---|---|---|---|---|
| 30-year Treasury yield | 21 days | −0.67 | −0.64 to +0.80 | – |
| 30-year Treasury yield | 63 days | −0.50 | −0.49 to +0.71 | – |
| 10y-3m curve | 21 days | −0.81 | −0.69 to +0.81 | – |
| 10y-3m curve | 63 days | −0.57 | −0.49 to +0.73 | – |
| 5y5y forward inflation | 63 days | −0.43 | −0.38 to +0.65 | – |
| 5y5y forward inflation | 126 days | −0.27 | −0.25 to +0.62 | – |
| 10-year term premium (model) | 21 days | −0.69 | −0.68 to +0.81 | – |
| 10-year term premium (model) | 63 days | −0.53 | −0.50 to +0.71 | – |
For your consideration. No relation broke strictly from its own history, so hedges and diversification sized on the past year still hold on this evidence. The one coherent exception is Consumer Staples, which has recently moved against rising yields more strongly than in 99% of its history since 1999. Against the 30-year yield, a volatility-adjusted check (Forbes and Rigobon) reads the one-month reading as partly a change in the relation and partly the market's higher volatility, and the three-month reading as the market's higher volatility, not a change in the relation. The signal is weaker than the raw correlation suggests, but a defensive sleeve held for stability may still be carrying rate risk.
Are they tradeable? We don't know yet, and this issue doesn't claim it.
- A pair being unusual today says nothing about whether it will return to normal, or how fast.
- 139 flags against 119 expected by chance means most of them are probably noise; we cannot yet tell which flags are the real ones.
- Testing exactly this, “unusually wide, bet on a return to normal”, is the subject of a new Gyre analytic in preparation, Pairs-Trade Analysis (gyreresearch.com/pairs-trade): how often a gap closes, how long it takes, and whether that pays after costs against SPY.
4.3 Leads and lags
Daily: 148 leads
Chance: under no effect at all, the chance that this test finds even one lead is at most 0.25% (39,600 pair-lags); it found 148.
- Mostly measurement timing: 140 of 148 are a one-day lag between series measured at different times of day (a 4 pm US close moves the next day's noon exchange rate or the next Tokyo session).
- Same measurement time: 8 leads, all small: largest |r| 0.12 to 2020 (median 0.11), at most 0.21 in 2021–2026.
| Leader time → follower time | Leads | Lag 1 day | Lags 2–5 | Lags 6–20 |
|---|---|---|---|---|
| US 4 pm close → New York noon | 95 | 95 | 0 | 0 |
| US 4 pm close → Tokyo | 15 | 15 | 0 | 0 |
| US 4 pm close → US afternoon | 11 | 11 | 0 | 0 |
| US afternoon → New York noon | 10 | 10 | 0 | 0 |
| New York noon → New York noon | 8 | 8 | 0 | 0 |
| New York noon → Tokyo | 5 | 5 | 0 | 0 |
| US 4 pm close → London | 2 | 2 | 0 | 0 |
| US afternoon → London | 1 | 1 | 0 | 0 |
| US afternoon → Tokyo | 1 | 1 | 0 | 0 |
| Leader → follower | Lag (days) | Found in (to 2020) | Confirmed in 2021–2026 |
|---|---|---|---|
| Broad dollar index → won per USD | 1 | +0.12 (3,726) | +0.21 (1,452) |
| peso per USD → won per USD | 1 | +0.11 (5,302) | +0.15 (1,452) |
| real per USD → won per USD | 1 | +0.11 (5,302) | +0.10 (1,452) |
| USD per euro → won per USD | 1 | −0.11 (5,302) | −0.21 (1,452) |
| Swiss franc per USD → won per USD | 1 | +0.08 (5,302) | +0.16 (1,452) |
| rupee per USD → won per USD | 1 | +0.07 (5,301) | +0.09 (1,452) |
| Swiss franc per USD → yuan per USD | 1 | +0.06 (5,311) | +0.08 (1,452) |
| USD per Australian dollar → yuan per USD | 1 | −0.06 (5,310) | −0.07 (1,452) |
For your consideration. None of the daily leads is large enough to trade after costs. The one-day pattern across markets matters for hedging across time zones: a move at the US close is matched in Tokyo and in the New York noon exchange rates a session later, so a hedge checked the same day can look mismatched when it is not.
Monthly: macro releases and markets
Chance: under no effect at all, the chance that this test finds even one lead is at most 0.25%; it found 13.
(i) Construction: 9 leads into monthly averages
GS10 and FEDFUNDS are monthly averages of daily series. A daily move shows in the average partly in its own month and partly in the next, so any market series that moves with rates leads the average by one month. A reading of the results, not a test.
| Leader → follower | Lag | Found in (to 2020) | Confirmed in 2021–2026 |
|---|---|---|---|
| yen per USD → 10-year yield (monthly avg.) | 1 | +0.33 (287) | +0.59 (68) |
| 10-year real yield → 10-year yield (monthly avg.) | 1 | +0.51 (214) | +0.76 (68) |
| 10-year Treasury yield → 10-year yield (monthly avg.) | 1 | +0.69 (287) | +0.81 (68) |
| 10-year Treasury yield → 10-year yield (monthly avg.) | 2 | +0.44 (287) | +0.27 (68) |
| 2-year Treasury yield → 10-year yield (monthly avg.) | 1 | +0.51 (287) | +0.70 (68) |
| 30-year Treasury yield → 10-year yield (monthly avg.) | 1 | +0.59 (287) | +0.77 (68) |
| 30-year Treasury yield → 10-year yield (monthly avg.) | 2 | +0.44 (287) | +0.24 (68) |
| 10-year term premium (model) → 10-year yield (monthly avg.) | 1 | +0.67 (287) | +0.73 (68) |
| 10-year term premium (model) → 10-year yield (monthly avg.) | 2 | +0.41 (287) | +0.24 (68) |
(ii) Energy: 2 leads
| Leader → follower | Lag | Found in (to 2020) | Confirmed in 2021–2026 |
|---|---|---|---|
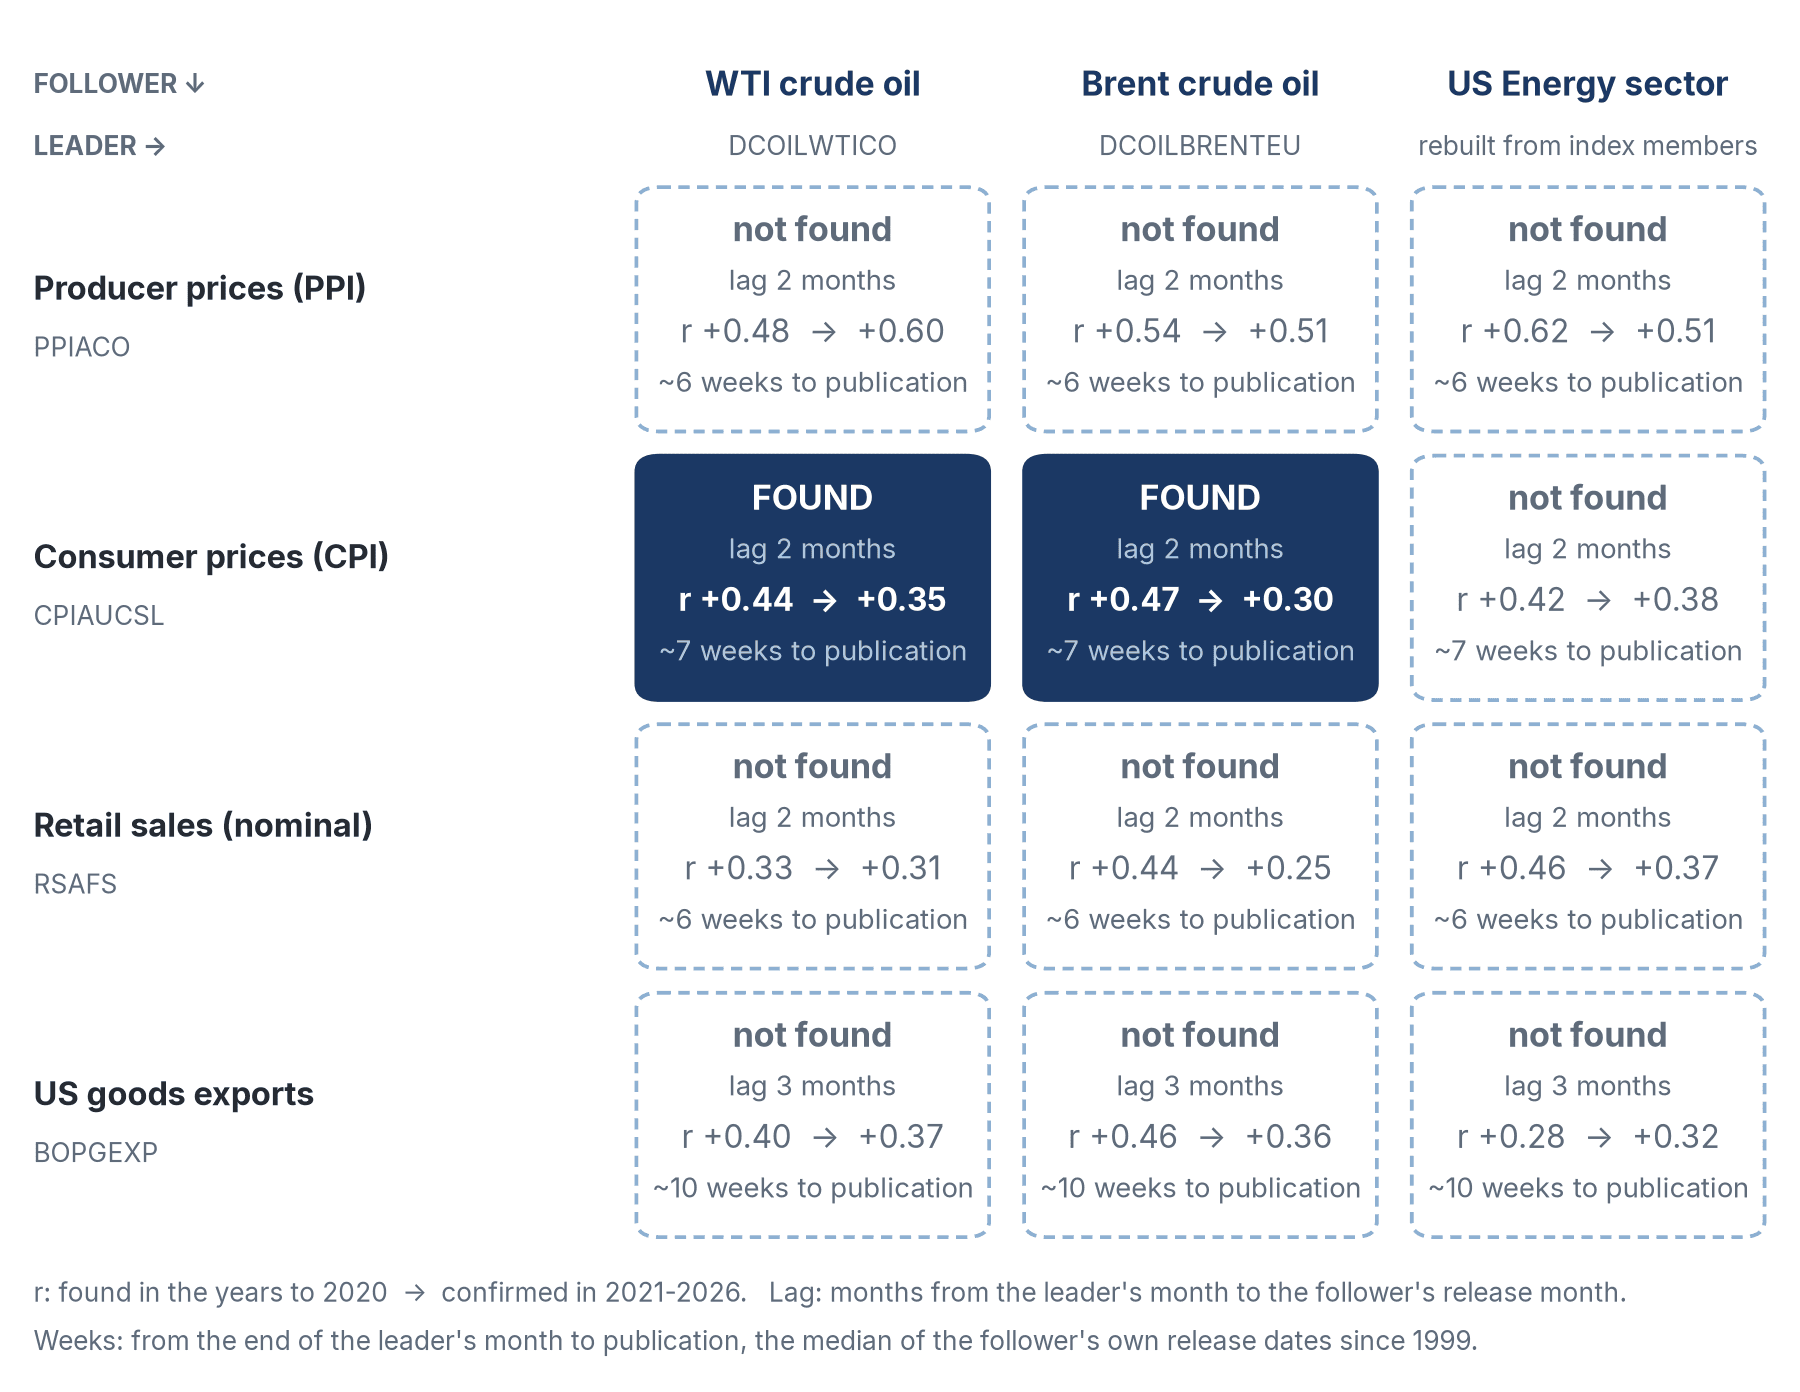
| Brent crude oil → Consumer prices | 2 | +0.47 (391) | +0.30 (66) |
| WTI crude oil → Consumer prices | 2 | +0.44 (406) | +0.35 (66) |
For your consideration. Oil gives some notice of the next consumer price print: its monthly change leads US CPI by two release months, and that lead held again after 2020. It is the only energy lead left once the test allows for clustered volatility and autocorrelation; energy stocks and producer prices no longer pass, and even oil-to-CPI does not survive the strictest family-wide check. A book exposed to inflation surprises can treat oil as a tendency worth watching ahead of the CPI release, not as a signal. This was tested against the published figures only, not against inflation-linked bonds or breakevens, where it may already be priced.
(iii) Others: 2 leads
| Leader → follower | Lag | Found in (to 2020) | Confirmed in 2021–2026 |
|---|---|---|---|
| 10y-3m curve → German 10-year yield | 2 | +0.48 (74) | +0.27 (62) |
| 10-year term premium (model) → German 10-year yield | 2 | +0.44 (74) | +0.32 (62) |
Coincident (lag 0): 0 pairs. No macro release passes the test against the same month's market move.
For your consideration. No confirmed monthly lead points into US stocks: in this test, macro releases gave no advance notice of stock or sector returns. They belong in risk budgeting and scenario analysis, not in market timing.
Quarterly
Chance: at most 0.25% under no effect; found 0, not confirmed 66.
Detection limit: 2021–2026 holds 11–23 quarters per pair, so only large leads can be confirmed. A lead found to 2020 but not confirmed is reported as "not confirmed", never as found.
No quarterly lead passes both the test to 2020 and the confirmation in 2021–2026; the 66 found to 2020 but not confirmed are in Appendix D.
4.4 Changes over the last 12 months
Chance: 38 notable changes of 181 tracked relations (the 20 strongest and every daily lead, monthly and quarterly lead); chance alone gives 18.1. Notable: the 12-month change is beyond the relation's own 5th or 95th percentile of 12-month changes.
- The strongest relations held: 0 of the 20 strongest changed notably.
- The overnight link weakened: 16 of the notable changes are one-day leads from US markets into the next Tokyo session (9) or the Australian dollar (7); every one is weaker than 12 months ago (median +0.42 to +0.10).
| Leader → follower (1 day) | 12 months ago | Now | Change | Pct. |
|---|---|---|---|---|
| Energy → Nikkei 225 | +0.42 | −0.06 | −0.48 | 0.0 |
| Health Care → Nikkei 225 | +0.36 | −0.04 | −0.39 | 1.0 |
| Communication Services → Nikkei 225 | +0.53 | +0.17 | −0.36 | 1.3 |
| Consumer Staples → Nikkei 225 | +0.21 | −0.12 | −0.34 | 4.3 |
| Energy → USD per Australian dollar | +0.36 | +0.03 | −0.33 | 1.3 |
| Materials → USD per Australian dollar | +0.41 | +0.10 | −0.32 | 0.3 |
| Consumer Discretionary → USD per Australian dollar | +0.41 | +0.10 | −0.31 | 0.3 |
| Industrials → USD per Australian dollar | +0.46 | +0.15 | −0.31 | 1.0 |
| Real Estate → Nikkei 225 | +0.32 | +0.03 | −0.29 | 4.0 |
| Information Technology → USD per Australian dollar | +0.43 | +0.15 | −0.28 | 2.3 |
| Financials → Nikkei 225 | +0.46 | +0.20 | −0.26 | 3.0 |
| S&P 500 → USD per Australian dollar | +0.45 | +0.20 | −0.25 | 2.3 |
| 10-year breakeven inflation → Nikkei 225 | +0.20 | −0.05 | −0.25 | 3.8 |
| Industrials → Nikkei 225 | +0.54 | +0.30 | −0.24 | 3.0 |
| Consumer Discretionary → Nikkei 225 | +0.48 | +0.27 | −0.21 | 3.0 |
| VIX → USD per Australian dollar | −0.36 | −0.11 | +0.25 | 100.0 |
For your consideration. Positions that rely on US moves carrying into the next Tokyo session or the Australian dollar (overnight hedges, relative-value pairs) have had a much weaker link over the past 12 months. Sizing them on longer history overstates the protection or the signal.
4.5 A post-run observation
4.6 Validation
24 of 24 pairs pass: the study's correlation equals the public calculator's to within 2e−12 (the bar is 1e−9); 6 pairs also equal a hand calculation from FRED's own download (largest difference 4e−14). Monthly changes, 2010-01 to 2025-12, lag 0.
| Pair | n | Calc. | Study | Diff. | By hand |
|---|---|---|---|---|---|
| INDPRO / PAYEMS | 192 | 0.841916 | 0.841916 | 3e−16 | 0.841916 |
| UNRATE / CIVPART | 191 | -0.762988 | -0.762988 | 2e−16 | -0.762988 |
| CPIAUCSL / CPILFESL | 191 | 0.663603 | 0.663603 | 0 | – |
| FEDFUNDS / GS10 | 192 | 0.188207 | 0.188207 | 6e−17 | – |
| HOUST / PERMIT | 192 | 0.251883 | 0.251883 | 6e−17 | – |
| M2SL / BUSLOANS | 192 | 0.584991 | 0.584991 | 2e−16 | – |
| RSAFS / DGORDER | 192 | 0.339313 | 0.339313 | 0 | – |
| TCU / INDPRO | 192 | 0.995997 | 0.995997 | 8e−16 | – |
| PSAVERT / TOTALSL | 192 | -0.149666 | -0.149666 | 0 | – |
| FRAPRMNTO01GPSAM / ITAPRMNTO01GPSAM | 193 | 0.828047 | 0.828047 | 4e−14 | 0.828047 |
| GBRPRINTO01GPSAM / JPNPRMNTO01GPSAM | 193 | 0.148533 | 0.148533 | 2e−12 | – |
| DEUSLRTTO01GPSAM / FRASLRTTO01GPSAM | 193 | 0.439433 | 0.439433 | 2e−13 | – |
| BSCICP02DEM460S / CSCICP02DEM460S | 192 | 0.531715 | 0.531715 | 1e−16 | 0.531715 |
| LRHUTTTTDEM156S / LRHUTTTTFRM156S | 192 | 0.029336 | 0.029336 | 2e−17 | – |
| IRLTLT01DEM156N / IRLTLT01FRM156N | 192 | 0.887171 | 0.887171 | 1e−13 | – |
| IR3TIB01DEM156N / IR3TIB01CAM156N | 192 | 0.500032 | 0.500032 | 0 | – |
| XTEXVA01DEM667S / XTEXVA01JPM667S | 192 | 0.295428 | 0.295428 | 3e−16 | 0.295428 |
| SPASTT01DEM661N / SPASTT01JPM661N | 192 | 0.661345 | 0.661345 | 2e−16 | – |
| CANPRMNTO01GPSAM / CANSLRTTO01GPSAM | 193 | 0.806517 | 0.806517 | 4e−13 | – |
| PCEPILFE / CPILFESL | 191 | 0.848693 | 0.848693 | 4e−16 | – |
| JTSJOL / UNRATE | 191 | -0.383272 | -0.383272 | 2e−16 | – |
| CES0500000003 / PAYEMS | 192 | -0.878959 | -0.878959 | 1e−15 | – |
| LRUNTTTTCAM156S / IRLTLT01CAM156N | 192 | -0.170991 | -0.170991 | 2e−12 | – |
| HPIPONM226S / MORTGAGE30US | 192 | 0.156516 | 0.156516 | 1e−16 | 0.156516 |
4.7 What changed after 2020
When the turn came: this section compares 1999–2020 with 2021–2026, a split fixed before the data were seen. A break test that lets the data choose the dates (Bai and Perron) puts the stock-yield turn at 1 April 2022 and the yield-dollar turn at 30 March 2022: both came when the Fed began raising rates in 2022, not at the turn of 2021.
Chance: under no change at all, the chance that this test finds even one change is at most 0.25% (102,773 tests); it found 400. A change counts when the 1999–2020 and 2021–2026 correlations differ beyond the false-discovery bar and the rank correlations agree.
Significance is not size: with about 68 months since 2021, no change in a monthly relation passes the test once its errors allow for clustered volatility and autocorrelation (section 3.2); every change below is between daily market series.
| Family | Tests | Found | Sign flips | |Δr| ≥ 0.3 | 0.2–0.3 | 0.1–0.2 | < 0.1 |
|---|---|---|---|---|---|---|---|
| Markets, daily | 990 | 400 | 180 | 70 | 122 | 200 | 8 |
| Macro and markets, monthly | 10,638 | 0 | 0 | 0 | 0 | 0 | 0 |
| Daily leads | 39,600 | 0 | 0 | 0 | 0 | 0 | 0 |
| Monthly leads | 179,820 | 0 | 0 | 0 | 0 | 0 | 0 |
Stocks and bond yields: the old relation is gone
- The headline change: the S&P 500's correlation with the 10-year Treasury yield went from +0.36 (1999–2020) to −0.10 (2021–2026); Real Estate from +0.19 to −0.34. The change passes every test, but the S&P 500's value since 2021 is close to zero (95% interval −0.21 to +0.01): before 2021 stocks and yields moved together, so Treasuries offset stock moves; since 2021 they are roughly unrelated. Real Estate now moves clearly against yields.
- It is broad: 19 of the 20 largest market changes are a stock sector or the index against a rate.
| Pair | 1999–2020 | 2021–2026 | Change | Sign |
|---|---|---|---|---|
| Real Estate / 10-year Treasury yield | +0.19 | −0.34 | −0.53 | FLIP |
| Real Estate / 10-year term premium (model) | +0.18 | −0.34 | −0.52 | FLIP |
| Real Estate / 30-year Treasury yield | +0.18 | −0.31 | −0.49 | FLIP |
| S&P 500 / 10-year Treasury yield | +0.36 | −0.10 | −0.46 | FLIP |
| Real Estate / 2-year Treasury yield | +0.21 | −0.25 | −0.46 | FLIP |
| Materials / 10-year Treasury yield | +0.33 | −0.13 | −0.45 | FLIP |
| Health Care / 10-year Treasury yield | +0.24 | −0.21 | −0.45 | FLIP |
| S&P 500 / 10-year term premium (model) | +0.33 | −0.09 | −0.42 | FLIP |
| Industrials / 10-year Treasury yield | +0.35 | −0.06 | −0.42 | FLIP |
| Health Care / 10-year term premium (model) | +0.21 | −0.21 | −0.42 | FLIP |
| Materials / 10-year term premium (model) | +0.30 | −0.12 | −0.42 | FLIP |
| Utilities / 10-year Treasury yield | +0.11 | −0.30 | −0.41 | FLIP |
| Health Care / 30-year Treasury yield | +0.23 | −0.18 | −0.41 | FLIP |
| Materials / 30-year Treasury yield | +0.32 | −0.09 | −0.41 | FLIP |
| S&P 500 / 30-year Treasury yield | +0.33 | −0.08 | −0.41 | FLIP |
| Consumer Discretionary / 10-year Treasury yield | +0.30 | −0.11 | −0.41 | FLIP |
| Real Estate / 10-year real yield | +0.00 | −0.40 | −0.40 | FLIP |
| Real Estate / 10y-3m curve | +0.11 | −0.29 | −0.40 | FLIP |
| 10-year Treasury yield / Broad dollar index | −0.08 | +0.31 | +0.39 | FLIP |
| Communication Services / Energy | +0.57 | +0.18 | −0.39 |
For your consideration. The core assumption of a balanced book, that Treasuries rise when stocks fall, has not held since the Fed began raising rates in 2022 (the data date the turn to 1 April 2022): the S&P 500's correlation with the 10-year yield fell from clearly positive to about zero, so Treasuries have stopped offsetting stock moves. Diversification sized on correlations from before 2022 is overstated; duration and equity risk should be measured together, and other diversifiers weighed against the current relation, not the long history.
The 10-year yield and the dollar
The 10-year yield and the broad dollar index went from −0.08 to +0.31: before 2021 unrelated, since then rising together. 9 rate-dollar pairs changed.
| Pair | 1999–2020 | 2021–2026 | Change | Sign |
|---|---|---|---|---|
| 10-year Treasury yield / Broad dollar index | −0.08 | +0.31 | +0.39 | FLIP |
| 10-year term premium (model) / Broad dollar index | −0.05 | +0.32 | +0.37 | FLIP |
| 30-year Treasury yield / Broad dollar index | −0.13 | +0.23 | +0.36 | FLIP |
| 10-year breakeven inflation / Broad dollar index | −0.36 | −0.01 | +0.36 | |
| 2-year Treasury yield / Broad dollar index | +0.00 | +0.32 | +0.31 | |
| 10y-3m curve / Broad dollar index | −0.05 | +0.21 | +0.26 | FLIP |
| 3-month Treasury yield / Broad dollar index | −0.01 | +0.19 | +0.20 | FLIP |
| Baa credit spread / Broad dollar index | +0.14 | −0.03 | −0.17 | FLIP |
| 10-year real yield / Broad dollar index | +0.18 | +0.35 | +0.17 |
For your consideration. Rising US yields have come with a stronger dollar since 2021, so long US duration and unhedged foreign assets now tend to lose at the same time. For a US-based investor they are no longer independent bets; currency hedging decisions and duration decisions should be taken together.
Leads that changed
No lead changed between 1999–2020 and 2021–2026: of 39,600 daily and 179,820 monthly lead tests, none passes once the test allows for clustered volatility and autocorrelation.
4.8 New since 2021
Chance: under no effect at all, the chance that this test finds even one relation is at most 0.25% (89,488 tests); it found 95: 94 relations and 1 lead. Found in 2021–2023, confirmed in 2024–2026, and absent (or of the other sign) in 1999–2020.
New relations: 94
88 among daily market pairs, 6 monthly. Most are rates against stocks, the dollar or currencies: the same shift as section 4.7, seen from the other side.
| Pair | Data | 1999–2020 | 2021–23 | 2024–2026 |
|---|---|---|---|---|
| Consumer prices / Core consumer prices | monthly | +0.33 | +0.56 | +0.64 |
| Financial conditions index / Baa credit spread | monthly | +0.72 | +0.47 | +0.57 |
| Consumer sentiment / Financial conditions index | monthly | −0.22 | −0.49 | −0.49 |
| Consumer prices / Core PCE prices | monthly | +0.30 | +0.59 | +0.46 |
| yen per USD / won per USD | daily | +0.03 | +0.18 | +0.45 |
| Real Estate / 10-year real yield | daily | +0.00 | −0.38 | −0.43 |
| Copper / Baa credit spread | monthly | −0.34 | −0.41 | −0.42 |
| Real Estate / 10-year Treasury yield | daily | +0.19 | −0.30 | −0.41 |
| Real Estate / 30-year Treasury yield | daily | +0.18 | −0.25 | −0.40 |
| Real Estate / 10y-3m curve | daily | +0.11 | −0.22 | −0.40 |
| Real Estate / 10-year term premium (model) | daily | +0.18 | −0.30 | −0.39 |
| yen per USD / Canadian dollar per USD | daily | +0.03 | +0.21 | +0.37 |
| Retail sales / Producer prices | monthly | +0.42 | +0.35 | +0.37 |
| yen per USD / USD per Australian dollar | daily | −0.07 | −0.39 | −0.36 |
| Utilities / 10-year real yield | daily | −0.04 | −0.36 | −0.34 |
| Utilities / 10-year Treasury yield | daily | +0.11 | −0.28 | −0.33 |
| Utilities / 10y-3m curve | daily | +0.01 | −0.21 | −0.32 |
| 2-year Treasury yield / Broad dollar index | daily | +0.00 | +0.31 | +0.32 |
| Real Estate / 2-year Treasury yield | daily | +0.21 | −0.22 | −0.31 |
| Utilities / 30-year Treasury yield | daily | +0.10 | −0.24 | −0.31 |
Mortgage rates and Real Estate stocks: −0.11 before 2021, −0.62 in 2021–23, −0.51 since 2024 (monthly). It is not counted among the new relations: with three years of monthly data, the 2021–23 reading (p = 0.014) does not clear the family-wide bar once the test allows for autocorrelation; the reading since 2024 is clearly negative (p = 0.006).
For your consideration. Real-estate stocks now trade largely as a rate position (mortgage rate against Real Estate −0.51 since 2024, −0.11 before 2021). REIT holdings belong in a book's interest-rate exposure, and their hedge ratio should come from the post-2021 relation, not the longer history.
New leads: 1
1 monthly, on short samples (n 17–18); the largest |r| is 0.71. 36 leads already found to 2020 were found again.
| Leader → follower | Lag | 2021–23 | 2024–2026 |
|---|---|---|---|
| Money supply (M2) → 10y-2y curve | 17 mo. | −0.71 (18) | −0.36 (17) |
Confirmation going forward
600 candidates were named on data to 2026-10-31 (158 daily market pairs; 282 monthly pairs; 125 daily leads; 35 monthly leads). Each month they are tested again on the data after that date only: a candidate is confirmed when the new data give the same sign, dropped when they give the opposite sign. Nothing is chosen again after the first naming.
4.9 What the stricter test changed
The same data and the same correlations, judged twice: first with the ordinary test, which assumes every day or month is independent and equally calm, then with tests that allow for clustered volatility and autocorrelation. Of 1,956 findings the ordinary test reported, 1,280 no longer pass. The other way, 29 results pass only under the stricter test (1 lead, 8 changes after 2020, 19 new relations, 1 new lead); none of them was reported in the earlier draft.
| Results | Found by the ordinary test | No longer pass | Interval includes 0 | Not robust to dependence |
|---|---|---|---|---|
| Values our notes rest on | 16 | 1 | 1 | 0 |
| Daily leads | 342 | 194 | 43 | 39 |
| Monthly leads | 78 | 66 | 7 | 6 |
| Quarterly leads | 3 | 3 | 0 | 0 |
| Changed after 2020: daily market pairs | 541 | 149 | 166 | 161 |
| Changed after 2020: monthly pairs | 618 | 618 | 298 | 0 |
| Changed after 2020: daily leads | 120 | 120 | 24 | 0 |
| Changed after 2020: monthly leads | 40 | 40 | 13 | 0 |
| New since 2021: daily market pairs | 79 | 4 | 5 | 19 |
| New since 2021: monthly pairs | 21 | 21 | 3 | 0 |
| New since 2021: daily leads | 93 | 62 | 26 | 14 |
| New since 2021: monthly leads | 5 | 2 | 0 | 3 |
What still holds: the stock-yield and rate-dollar sign flips since 2021, the overnight links into Tokyo and the Australian dollar, the absence of any macro lead into US stocks, oil's lead over consumer prices. What does not: most monthly leads, every quarterly lead, every change in a monthly relation or a lead after 2020, and most energy leads.
Section 5What the data cannot tell you
- Not investment advice: the notes headed "For your consideration" describe measured relations and what they imply for risk; no trade was tested, and nothing in this paper is a recommendation to buy or sell.
- Gaps: no PMI (proprietary for every country); no current monthly CPI for the UK, Japan, Canada, China, India or Brazil; no monthly unemployment for China, India, Brazil or the euro area; no German total production; no services trade, capital flows, current account, deficit or productivity series that are monthly and current. Italy and UK wages are published only as year-on-year growth, which the method excludes.
- Sector history is rebuilt: each company carries its current sector label back in time; Real Estate was part of Financials until 2016 and Communication Services was formed in 2018. In 1999 8.0% of the index weight had no sector label (3.3% in 2005, 2.0% in 2010, 0.1% in 2020).
- Two price histories are joined to reach back to 1999.
- Measurement times differ: stocks close at 4 pm New York, Treasury yields are afternoon quotes, the Federal Reserve's exchange rates are noon New York, Brent is London, the Nikkei is Tokyo, crypto trades around the clock; pairs across these are measured on two-day changes.
- Exchange rates are published weekly, so their latest week lags the other series.
- Model estimates, not prices: the term premium and the policy uncertainty index.
- Revisions: correlations use today's revised values; leads and lags use the values first published.
- First-published values start at different dates: from 1927 to 2023 by series (Appendix B). A lead test can only start there.
- Missing changes: WTI closed below zero on 2020-04-20, so its 2 daily changes touching that day are missing; Brazil's share price index rounds to zero in 1980–1988, so 105 monthly changes there are missing.
- Indexes centred on zero: CFNAI (53.45% of its values since 1999 at or below zero) and NFCI (90.84% of its values since 1999 at or below zero) are measured as change in level, not percent change.
- Duplicate series kept once: the French and Italian 3-month interbank rates equal the German one since 1999; it is kept once, as the euro area 3-month interbank rate.
- Readings: the labels construction and timing are readings of the results, not tests.
- Corrected: a first run's monthly and quarterly lead tests mixed index bases across rebasings; it was corrected before publication.
- First prints left out: 3 first-published values that FRED corrected in its next release (BRABCCICP02STSAM 2018-10; CSCICP02BRM460S 2019-06; XTEXVA01CNM667S 2014-10) are left out of the lead tests.
- Correlation is not causation, and a past relation is not a forecast.
AppendixA. The series
| Series | What | As | Series | What | As |
|---|---|---|---|---|---|
| (Gyre) | S&P 500 (cap-weighted, rebuilt) | % | CP0000EZ19M086NEST | HICP, core HICP, EA | % |
| (Gyre) | Communication Services sector | % | CP0000DEM086NEST | HICP, core HICP, DE | % |
| (Gyre) | Consumer Discretionary sector | % | CP0000FRM086NEST | HICP, core HICP, FR | % |
| (Gyre) | Consumer Staples sector | % | CP0000ITM086NEST | HICP, core HICP, IT | % |
| (Gyre) | Energy sector | % | TOTNRGFOODEA20MI15XM | HICP, core HICP, EA | % |
| (Gyre) | Financials sector | % | 00XEFDDEM086NEST | HICP, core HICP, DE | % |
| (Gyre) | Health Care sector | % | 00XEFDFRM086NEST | HICP, core HICP, FR | % |
| (Gyre) | Industrials sector | % | 00XEFDITM086NEST | HICP, core HICP, IT | % |
| (Gyre) | Information Technology sector | % | LRHUTTTTDEM156S | Unemployment, participation, DE | Δ |
| (Gyre) | Materials sector | % | LRHUTTTTFRM156S | Unemployment, participation, FR | Δ |
| (Gyre) | Real Estate sector | % | LRHUTTTTITM156S | Unemployment, participation, IT | Δ |
| (Gyre) | Utilities sector | % | LRHUTTTTGBM156S | Unemployment, participation, GB | Δ |
| DGS3MO | 3-month Treasury yield | Δ | LRHUTTTTJPM156S | Unemployment, participation, JP | Δ |
| DGS2 | 2-year Treasury yield | Δ | LRUNTTTTCAM156S | Unemployment, participation, CA | Δ |
| DGS10 | 10-year Treasury yield | Δ | LRACTTTTJPM156S | Unemployment, participation, JP | Δ |
| DGS30 | 30-year Treasury yield | Δ | LRACTTTTCAM156S | Unemployment, participation, CA | Δ |
| T10Y2Y | 10y-2y curve | Δ | LCEAMN01ITM659S | Wages, IT | – |
| T10Y3M | 10y-3m curve | Δ | LCEAMN01GBM659S | Wages, GB | – |
| DFII10 | 10-year real yield | Δ | JPNLCEAMN01GPSAM | Wages, JP | = |
| T10YIE | 10-year breakeven inflation | Δ | LCEAMN01CAM657S | Wages, CA | = |
| T5YIFR | 5y5y forward inflation | Δ | CSCICP02DEM460S | Consumer confidence, DE | Δ |
| THREEFYTP10 | 10-year term premium (model) | Δ | CSCICP02FRM460S | Consumer confidence, FR | Δ |
| BAA10Y | Baa credit spread | Δ | CSCICP02ITM460S | Consumer confidence, IT | Δ |
| VIXCLS | VIX | % | CSCICP02GBM460S | Consumer confidence, GB | Δ |
| OVXCLS | Oil volatility | % | CSCICP02JPM460S | Consumer confidence, JP | Δ |
| GVZCLS | Gold volatility | % | CSCICP02CNM460S | Consumer confidence, CN | Δ |
| USEPUINDXD | Economic policy uncertainty (model) | % | CSCICP02BRM460S | Consumer confidence, BR | Δ |
| DTWEXBGS | Broad dollar index | % | IR3TIB01DEM156N | Short rates, EA | Δ |
| DEXUSEU | USD per euro | % | IR3TIB01JPM156N | Short rates, JP | Δ |
| DEXJPUS | yen per USD | % | IR3TIB01CAM156N | Short rates, CA | Δ |
| DEXCHUS | yuan per USD | % | IR3TIB01CNM156N | Short rates, CN | Δ |
| DEXUSUK | USD per pound | % | INDIR3TIB01STM | Short rates, IN | Δ |
| DEXCAUS | Canadian dollar per USD | % | IRLTLT01DEM156N | German 10-year yield | Δ |
| DEXINUS | rupee per USD | % | IRLTLT01FRM156N | 10-year yields, FR | Δ |
| DEXBZUS | real per USD | % | IRLTLT01ITM156N | 10-year yields, IT | Δ |
| DEXMXUS | peso per USD | % | IRLTLT01GBM156N | 10-year yields, GB | Δ |
| DEXKOUS | won per USD | % | IRLTLT01JPM156N | 10-year yields, JP | Δ |
| DEXSZUS | Swiss franc per USD | % | IRLTLT01CAM156N | 10-year yields, CA | Δ |
| DEXUSAL | USD per Australian dollar | % | INDIRLTLT01STM | 10-year yields, IN | Δ |
| DCOILWTICO | WTI crude oil | % | XTEXVA01DEM667S | Exports (US $), DE | % |
| DHHNGSP | US natural gas | % | XTEXVA01FRM667S | Exports (US $), FR | % |
| DCOILBRENTEU | Brent crude oil | % | XTEXVA01ITM667S | Exports (US $), IT | % |
| NIKKEI225 | Nikkei 225 | % | XTEXVA01GBM667S | Exports (US $), GB | % |
| CBBTCUSD | Bitcoin | % | XTEXVA01JPM667S | Exports (US $), JP | % |
| CBETHUSD | Ether | % | XTEXVA01CAM667S | Exports (US $), CA | % |
| INDPRO | US industrial production | % | XTEXVA01CNM667S | Exports (US $), CN | % |
| TCU | Capacity utilization | Δ | XTEXVA01INM667S | Exports (US $), IN | % |
| RSAFS | Retail sales | % | XTEXVA01BRM667S | Exports (US $), BR | % |
| DGORDER | Durable goods orders | % | SPASTT01DEM661N | Share prices, DE | % |
| CFNAI | Chicago Fed activity index | Δ | SPASTT01FRM661N | Share prices, FR | % |
| CPIAUCSL | Consumer prices | % | SPASTT01ITM661N | Share prices, IT | % |
| CPILFESL | Core consumer prices | % | SPASTT01GBM661N | Share prices, GB | % |
| PCEPILFE | Core PCE prices | % | SPASTT01JPM661N | Share prices, JP | % |
| PPIACO | Producer prices | % | SPASTT01CAM661N | Share prices, CA | % |
| UNRATE | US unemployment rate | Δ | SPASTT01CNM661N | Share prices, CN | % |
| PAYEMS | US payrolls | % | SPASTT01INM661N | Share prices, IN | % |
| ICSA | Jobless claims | % | SPASTT01BRM661N | Share prices, BR | % |
| JTSJOL | Job openings | % | PFOODINDEXM | World food prices | % |
| CIVPART | Labour force participation | Δ | PNGASEUUSDM | European natural gas | % |
| CES0500000003 | Average hourly earnings | % | PNGASJPUSDM | Japan natural gas | % |
| UMCSENT | Consumer sentiment | % | PCOPPUSDM | Copper | % |
| FEDFUNDS | Fed funds (monthly avg.) | Δ | PWHEAMTUSDM | Wheat | % |
| GS10 | 10-year yield (monthly avg.) | Δ | GDPC1 | US real GDP | % |
| BUSLOANS | Business loans | % | CLVMNACSCAB1GQDE | Real GDP, DE | % |
| TOTALSL | Consumer credit | % | CLVMNACSCAB1GQFR | Real GDP, FR | % |
| M2SL | Money supply (M2) | % | CLVMNACSCAB1GQIT | Real GDP, IT | % |
| PSAVERT | Saving rate | Δ | NGDPRSAXDCGBQ | Real GDP, GB | % |
| HOUST | Housing starts | % | JPNRGDPEXP | Real GDP, JP | % |
| PERMIT | Building permits | % | NGDPRSAXDCCAQ | Real GDP, CA | % |
| HPIPONM226S | US house prices | % | NGDPRSAXDCBRQ | Real GDP, BR | % |
| MORTGAGE30US | 30-year mortgage rate | Δ | NGDPRNSAXDCINQ | Real GDP, IN | % |
| NFCI | Financial conditions index | Δ | CLVMEURSCAB1GQEA19 | Real GDP, EA | % |
| BOPGEXP | US goods exports | % | NFIRSAXDCUSQ | Fixed investment, US | % |
| BSCICP02DEM460S | Business confidence, DE | Δ | NFIRSAXDCDEQ | Fixed investment, DE | % |
| BSCICP02FRM460S | Business confidence, FR | Δ | NFIRSAXDCFRQ | Fixed investment, FR | % |
| BSCICP02ITM460S | Business confidence, IT | Δ | NFIRSAXDCITQ | Fixed investment, IT | % |
| BSCICP02GBM460S | Business confidence, GB | Δ | NFIRSAXDCGBQ | Fixed investment, GB | % |
| CHNBSCICP02STSAM | Business confidence, CN | Δ | NFIRSAXDCJPQ | Fixed investment, JP | % |
| BRABCCICP02STSAM | Business confidence, BR | Δ | NFIRSAXDCCAQ | Fixed investment, CA | % |
| FRAPRMNTO01GPSAM | Industrial production (GP), FR | = | NFIRSAXDCBRQ | Fixed investment, BR | % |
| ITAPRMNTO01GPSAM | Industrial production (GP), IT | = | NFIRNSAXDCINQ | Fixed investment, IN | % |
| GBRPRINTO01GPSAM | Industrial production (GP), GB | = | QUSN628BIS | House prices (BIS), US | % |
| JPNPRMNTO01GPSAM | Industrial production (GP), JP | = | QDEN628BIS | House prices (BIS), DE | % |
| CANPRMNTO01GPSAM | Industrial production (GP), CA | = | QFRN628BIS | House prices (BIS), FR | % |
| INDPRINTO01GPSAM | Industrial production (GP), IN | = | QITN628BIS | House prices (BIS), IT | % |
| BRAPRINTO01GPSAM | Industrial production (GP), BR | = | QGBN628BIS | House prices (BIS), GB | % |
| DEUSLRTTO01GPSAM | Retail volume (GP), DE | = | QCAN628BIS | House prices (BIS), CA | % |
| FRASLRTTO01GPSAM | Retail volume (GP), FR | = | QCNN628BIS | House prices (BIS), CN | % |
| ITASLRTTO01GPSAM | Retail volume (GP), IT | = | QINN628BIS | House prices (BIS), IN | % |
| GBRSLRTTO01GPSAM | Retail volume (GP), GB | = | QBRN628BIS | House prices (BIS), BR | % |
| JPNSLRTTO01GPSAM | Retail volume (GP), JP | = | QXMN628BIS | House prices (BIS), EA | % |
| CANSLRTTO01GPSAM | Retail volume (GP), CA | = | GFDEGDQ188S | US federal debt to GDP | Δ |
| BRASLRTTO01GPSAM | Retail volume (GP), BR | = |
Sources
Source: FRED, Federal Reserve Bank of St. Louis. Each FRED series' original source, as FRED lists it; † = FRED's terms ask for this source to be cited.
| Source | Series |
|---|---|
| Bank for International Settlements | QUSN628BIS†, QDEN628BIS†, QFRN628BIS†, QITN628BIS†, QGBN628BIS†, QCAN628BIS†, QCNN628BIS†, QINN628BIS†, QBRN628BIS†, QXMN628BIS† |
| Board of Governors of the Federal Reserve System (US) | DGS3MO, DGS2, DGS10, DGS30, DFII10, THREEFYTP10, DTWEXBGS, DEXUSEU, DEXJPUS, DEXCHUS, DEXUSUK, DEXCAUS, DEXINUS, DEXBZUS, DEXMXUS, DEXKOUS, DEXSZUS, DEXUSAL, INDPRO, TCU, FEDFUNDS, GS10, BUSLOANS, TOTALSL, M2SL |
| Chicago Board Options Exchange | VIXCLS†, OVXCLS†, GVZCLS† |
| Coinbase | CBBTCUSD†, CBETHUSD† |
| Davis, Steven J. | USEPUINDXD |
| Eurostat | CP0000EZ19M086NEST†, CP0000DEM086NEST†, CP0000FRM086NEST†, CP0000ITM086NEST†, TOTNRGFOODEA20MI15XM†, 00XEFDDEM086NEST†, 00XEFDFRM086NEST†, 00XEFDITM086NEST†, CLVMNACSCAB1GQDE†, CLVMNACSCAB1GQFR†, CLVMNACSCAB1GQIT†, CLVMEURSCAB1GQEA19† |
| Federal Reserve Bank of Chicago | CFNAI†, NFCI† |
| Federal Reserve Bank of St. Louis | T10Y2Y†, T10Y3M†, T10YIE†, T5YIFR†, BAA10Y† |
| Freddie Mac | MORTGAGE30US† |
| Gyre Research (calculated) | S&P 500, Communication Services, Consumer Discretionary, Consumer Staples, Energy, Financials, Health Care, Industrials, Information Technology, Materials, Real Estate, Utilities |
| International Monetary Fund | PFOODINDEXM†, PNGASEUUSDM†, PNGASJPUSDM†, PCOPPUSDM†, PWHEAMTUSDM†, NGDPRSAXDCGBQ†, NGDPRSAXDCCAQ†, NGDPRSAXDCBRQ†, NGDPRNSAXDCINQ†, NFIRSAXDCUSQ†, NFIRSAXDCDEQ†, NFIRSAXDCFRQ†, NFIRSAXDCITQ†, NFIRSAXDCGBQ†, NFIRSAXDCJPQ†, NFIRSAXDCCAQ†, NFIRSAXDCBRQ†, NFIRNSAXDCINQ† |
| JP. Cabinet Office | JPNRGDPEXP† |
| Nikkei Industry Research Institute | NIKKEI225† |
| Organization for Economic Co-operation and Development | BSCICP02DEM460S†, BSCICP02FRM460S†, BSCICP02ITM460S†, BSCICP02GBM460S†, CHNBSCICP02STSAM†, BRABCCICP02STSAM†, FRAPRMNTO01GPSAM†, ITAPRMNTO01GPSAM†, GBRPRINTO01GPSAM†, JPNPRMNTO01GPSAM†, CANPRMNTO01GPSAM†, INDPRINTO01GPSAM†, BRAPRINTO01GPSAM†, DEUSLRTTO01GPSAM†, FRASLRTTO01GPSAM†, ITASLRTTO01GPSAM†, GBRSLRTTO01GPSAM†, JPNSLRTTO01GPSAM†, CANSLRTTO01GPSAM†, BRASLRTTO01GPSAM†, LRHUTTTTDEM156S†, LRHUTTTTFRM156S†, LRHUTTTTITM156S†, LRHUTTTTGBM156S†, LRHUTTTTJPM156S†, LRUNTTTTCAM156S†, LRACTTTTJPM156S†, LRACTTTTCAM156S†, LCEAMN01ITM659S†, LCEAMN01GBM659S†, JPNLCEAMN01GPSAM†, LCEAMN01CAM657S†, CSCICP02DEM460S†, CSCICP02FRM460S†, CSCICP02ITM460S†, CSCICP02GBM460S†, CSCICP02JPM460S†, CSCICP02CNM460S†, CSCICP02BRM460S†, IR3TIB01DEM156N†, IR3TIB01JPM156N†, IR3TIB01CAM156N†, IR3TIB01CNM156N†, INDIR3TIB01STM†, IRLTLT01DEM156N†, IRLTLT01FRM156N†, IRLTLT01ITM156N†, IRLTLT01GBM156N†, IRLTLT01JPM156N†, IRLTLT01CAM156N†, INDIRLTLT01STM†, XTEXVA01DEM667S†, XTEXVA01FRM667S†, XTEXVA01ITM667S†, XTEXVA01GBM667S†, XTEXVA01JPM667S†, XTEXVA01CAM667S†, XTEXVA01CNM667S†, XTEXVA01INM667S†, XTEXVA01BRM667S†, SPASTT01DEM661N†, SPASTT01FRM661N†, SPASTT01ITM661N†, SPASTT01GBM661N†, SPASTT01JPM661N†, SPASTT01CAM661N†, SPASTT01CNM661N†, SPASTT01INM661N†, SPASTT01BRM661N† |
| U.S. Bureau of Economic Analysis | PCEPILFE, PSAVERT, GDPC1 |
| U.S. Bureau of Labor Statistics | CPIAUCSL, CPILFESL, PPIACO, UNRATE, PAYEMS, JTSJOL, CIVPART, CES0500000003 |
| U.S. Census Bureau | RSAFS, DGORDER, BOPGEXP |
| U.S. Department of Housing and Urban Development | HOUST, PERMIT |
| U.S. Employment and Training Administration | ICSA |
| U.S. Energy Information Administration | DCOILWTICO, DHHNGSP, DCOILBRENTEU |
| U.S. Federal Housing Finance Agency | HPIPONM226S |
| U.S. Office of Management and Budget | GFDEGDQ188S |
| University of Michigan | UMCSENT† |
AppendixB. First-published values: coverage
The first release FRED holds for each monthly and quarterly series (its vintage history): a lead test on first-published values starts here.
| Series | First release | Series | First release |
|---|---|---|---|
| INDPRO | 1927-02-28 | CSCICP02GBM460S | 2013-07-01 |
| TCU | 1996-12-16 | CSCICP02JPM460S | 2013-07-01 |
| RSAFS | 2001-07-13 | CSCICP02CNM460S | 2013-07-01 |
| DGORDER | 1999-08-25 | CSCICP02BRM460S | 2013-07-01 |
| CFNAI | 2011-06-23 | IR3TIB01DEM156N | 2013-07-01 |
| CPIAUCSL | 1972-08-22 | IR3TIB01JPM156N | 2013-07-01 |
| CPILFESL | 1997-01-14 | IR3TIB01CAM156N | 2013-07-01 |
| PCEPILFE | 2000-08-28 | IR3TIB01CNM156N | 2013-08-21 |
| PPIACO | 1997-01-09 | INDIR3TIB01STM | 2018-09-05 |
| UNRATE | 1960-04-12 | IRLTLT01DEM156N | 2013-07-01 |
| PAYEMS | 1955-06-07 | IRLTLT01FRM156N | 2013-07-01 |
| ICSA | 2009-06-04 | IRLTLT01ITM156N | 2013-08-01 |
| JTSJOL | 2010-09-08 | IRLTLT01GBM156N | 2013-07-01 |
| CIVPART | 1997-03-07 | IRLTLT01JPM156N | 2013-07-01 |
| CES0500000003 | 2011-04-01 | IRLTLT01CAM156N | 2013-07-01 |
| UMCSENT | 1998-08-28 | INDIRLTLT01STM | 2018-09-05 |
| FEDFUNDS | 1997-01-07 | XTEXVA01DEM667S | 2013-07-01 |
| GS10 | 1997-01-07 | XTEXVA01FRM667S | 2013-07-01 |
| BUSLOANS | 1997-01-10 | XTEXVA01ITM667S | 2013-07-01 |
| TOTALSL | 1997-01-08 | XTEXVA01GBM667S | 2013-07-01 |
| M2SL | 1980-02-15 | XTEXVA01JPM667S | 2013-07-01 |
| PSAVERT | 1997-03-03 | XTEXVA01CAM667S | 2013-07-01 |
| HOUST | 1960-08-18 | XTEXVA01CNM667S | 2013-07-01 |
| PERMIT | 1999-09-17 | XTEXVA01INM667S | 2013-10-01 |
| HPIPONM226S | 2012-06-21 | XTEXVA01BRM667S | 2013-07-01 |
| MORTGAGE30US | 2010-06-24 | SPASTT01DEM661N | 2013-07-01 |
| NFCI | 2011-06-02 | SPASTT01FRM661N | 2013-08-21 |
| BOPGEXP | 1997-02-19 | SPASTT01ITM661N | 2013-07-01 |
| BSCICP02DEM460S | 2013-07-01 | SPASTT01GBM661N | 2013-07-01 |
| BSCICP02FRM460S | 2013-08-01 | SPASTT01JPM661N | 2013-07-01 |
| BSCICP02ITM460S | 2013-07-01 | SPASTT01CAM661N | 2013-07-01 |
| BSCICP02GBM460S | 2013-07-01 | SPASTT01CNM661N | 2013-07-01 |
| CHNBSCICP02STSAM | 2018-10-09 | SPASTT01INM661N | 2013-07-01 |
| BRABCCICP02STSAM | 2018-10-09 | SPASTT01BRM661N | 2013-07-01 |
| FRAPRMNTO01GPSAM | 2018-09-13 | PFOODINDEXM | 2015-12-07 |
| ITAPRMNTO01GPSAM | 2018-09-05 | PNGASEUUSDM | 2015-12-07 |
| GBRPRINTO01GPSAM | 2018-09-13 | PNGASJPUSDM | 2015-12-07 |
| JPNPRMNTO01GPSAM | 2018-09-05 | PCOPPUSDM | 2015-12-07 |
| CANPRMNTO01GPSAM | 2018-09-05 | PWHEAMTUSDM | 2015-12-07 |
| INDPRINTO01GPSAM | 2018-09-05 | GDPC1 | 1992-01-29 |
| BRAPRINTO01GPSAM | 2018-09-05 | CLVMNACSCAB1GQDE | 2016-08-12 |
| DEUSLRTTO01GPSAM | 2018-09-05 | CLVMNACSCAB1GQFR | 2016-04-29 |
| FRASLRTTO01GPSAM | 2018-09-05 | CLVMNACSCAB1GQIT | 2016-08-12 |
| ITASLRTTO01GPSAM | 2018-09-05 | NGDPRSAXDCGBQ | 2021-08-30 |
| GBRSLRTTO01GPSAM | 2018-09-05 | JPNRGDPEXP | 2017-02-12 |
| JPNSLRTTO01GPSAM | 2018-09-05 | NGDPRSAXDCCAQ | 2022-01-24 |
| CANSLRTTO01GPSAM | 2018-09-05 | NGDPRSAXDCBRQ | 2021-09-20 |
| BRASLRTTO01GPSAM | 2018-09-05 | NGDPRNSAXDCINQ | 2022-01-31 |
| CP0000EZ19M086NEST | 2015-03-18 | CLVMEURSCAB1GQEA19 | 2016-04-29 |
| CP0000DEM086NEST | 2012-07-15 | NFIRSAXDCUSQ | 2022-02-07 |
| CP0000FRM086NEST | 2012-07-15 | NFIRSAXDCDEQ | 2021-10-18 |
| CP0000ITM086NEST | 2012-07-15 | NFIRSAXDCFRQ | 2021-08-30 |
| TOTNRGFOODEA20MI15XM | 2023-09-19 | NFIRSAXDCITQ | 2021-11-01 |
| 00XEFDDEM086NEST | 2012-07-15 | NFIRSAXDCGBQ | 2021-08-30 |
| 00XEFDFRM086NEST | 2012-07-15 | NFIRSAXDCJPQ | 2021-09-13 |
| 00XEFDITM086NEST | 2012-07-15 | NFIRSAXDCCAQ | 2022-01-24 |
| LRHUTTTTDEM156S | 2013-07-01 | NFIRSAXDCBRQ | 2021-09-20 |
| LRHUTTTTFRM156S | 2013-07-01 | NFIRNSAXDCINQ | 2022-01-31 |
| LRHUTTTTITM156S | 2013-07-01 | QUSN628BIS | 2014-11-21 |
| LRHUTTTTGBM156S | 2013-07-01 | QDEN628BIS | 2014-11-21 |
| LRHUTTTTJPM156S | 2013-07-01 | QFRN628BIS | 2014-11-21 |
| LRUNTTTTCAM156S | 2013-07-01 | QITN628BIS | 2014-11-21 |
| LRACTTTTJPM156S | 2013-07-01 | QGBN628BIS | 2014-11-21 |
| LRACTTTTCAM156S | 2013-07-01 | QCAN628BIS | 2014-11-21 |
| JPNLCEAMN01GPSAM | 2018-09-05 | QCNN628BIS | 2014-11-21 |
| LCEAMN01CAM657S | 2013-07-01 | QINN628BIS | 2014-11-21 |
| CSCICP02DEM460S | 2013-07-01 | QBRN628BIS | 2014-11-21 |
| CSCICP02FRM460S | 2013-08-01 | QXMN628BIS | 2014-11-21 |
| CSCICP02ITM460S | 2013-07-01 | GFDEGDQ188S | 2012-12-06 |
AppendixC. Method reference
- Pre-registration: analytics/backtest_methodology.md section 15 in Gyre Research's repository, written and committed before any result.
- Commits: each code below identifies one dated entry in Gyre's version history (a “commit”) that cannot be changed afterwards. Together they show that each part of the method was written down before the results it governs were computed; we can show any entry on request.
- 9208deda0: the study plan itself (section 15): which series, which tests, and what counts as a finding.
- 4d031480d: corrections to the plan before the first run (15.9): how the data reaches the study, identical series counted once, leads tested in both directions.
- 2c385d774: leads of up to six quarters, and the test on quarterly data (15.9.8).
- a9fa03425: how values at or below zero are handled, where a percent change has no meaning (15.9.9).
- 95d31f206: the count of chance findings measured from 1999, the study's start (15.9.10).
- 0a4c45838: the comparison of before and after 2020, and what is new since 2021 (15.10).
- ecadeb316: changes within a release, values revised after their first publication (15.11, method version 2).
- ad39bca4a and e7ec5e5ea: the named first-published values left out (15.11).
- 86d0ee586 and 26ea63e69: the stricter significance test this issue uses throughout, and how it is computed (15.13, 15.14, method version 3).
- 66d9baaf5: the check that separates a real change in a relation from a more volatile market, used for Consumer Staples (15.16).
- 7889563c8: the break test that dates the 2022 turns (15.18).
- Implementation readings: analytics/macro_correlation/macro_correlation.md section 3, written before any result.
- This paper's data: study run 781173, the record of this computation in Gyre's run log (store run 12, method version 3, data to 2026-10-31); validation run 770045, the run that checked the study's values against the data providers' own downloads (section 4.6).
AppendixD. Full result lists
Every aberration flag
| Pair | Flags: window (days) and baseline |
|---|---|
| Brent crude oil / Ether | 63h, 126hv |
| WTI crude oil / Brent crude oil | 21h, 21g, 63g |
| yuan per USD / WTI crude oil | 63g |
| yuan per USD / peso per USD | 21g |
| yuan per USD / Nikkei 225 | 21g, 63g |
| rupee per USD / Brent crude oil | 126h |
| rupee per USD / WTI crude oil | 126hv |
| won per USD / Ether | 126hv |
| USD per pound / WTI crude oil | 63g |
| 10-year Treasury yield / Oil volatility | 21g |
| 10-year Treasury yield / VIX | 21g |
| 2-year Treasury yield / VIX | 21g |
| 30-year Treasury yield / Nikkei 225 | 21h, 21g, 63g |
| 30-year Treasury yield / Oil volatility | 21g |
| Communication Services / Canadian dollar per USD | 63h, 63g |
| Communication Services / yuan per USD | 63g |
| Communication Services / yen per USD | 21g |
| Communication Services / 2-year Treasury yield | 21gv |
| Communication Services / 3-month Treasury yield | 63g |
| Communication Services / Industrials | 63h, 126h |
| Communication Services / Information Technology | 126h |
| Communication Services / Utilities | 126hv |
| Communication Services / VIX | 63h, 126h |
| Consumer Discretionary / 10-year real yield | 21g |
| Consumer Discretionary / 10-year Treasury yield | 21g |
| Consumer Discretionary / 2-year Treasury yield | 21g |
| Consumer Discretionary / 30-year Treasury yield | 21gv |
| Consumer Discretionary / Consumer Staples | 21h |
| Consumer Discretionary / Energy | 21hv |
| Consumer Discretionary / Financials | 21hv |
| Consumer Discretionary / Real Estate | 126h |
| Consumer Discretionary / 10y-3m curve | 21gv |
| Consumer Staples / real per USD | 126h |
| Consumer Staples / yuan per USD | 126hv |
| Consumer Staples / peso per USD | 126hv |
| Consumer Staples / 30-year Treasury yield | 21h, 63h |
| Consumer Staples / Financials | 63g |
| Consumer Staples / Industrials | 126h |
| Consumer Staples / Information Technology | 21h, 126h |
| Consumer Staples / Materials | 126hv |
| Consumer Staples / Gold volatility | 126h |
| Consumer Staples / Nikkei 225 | 126h |
| Consumer Staples / 10y-3m curve | 21h, 63h |
| Consumer Staples / 5y5y forward inflation | 63h, 126h |
| Consumer Staples / 10-year term premium (model) | 21h, 63h |
| Consumer Staples / VIX | 21h, 126h |
| Energy / Bitcoin | 63h |
| Energy / Health Care | 21h |
| Energy / Industrials | 126hv |
| Energy / Information Technology | 63h, 126hv |
| Energy / Materials | 126hv |
| Energy / Nikkei 225 | 126hv |
| Energy / VIX | 21hv, 126hv |
| Financials / Information Technology | 126h |
| Financials / Nikkei 225 | 63hv, 126h |
| Financials / 10-year breakeven inflation | 63hv, 126hv |
| Financials / 5y5y forward inflation | 126h |
| Financials / VIX | 21h, 63hv, 126h, 126g |
| Health Care / Industrials | 63hv, 126h |
| Health Care / Information Technology | 126h |
| Health Care / Gold volatility | 63hv, 126h |
| Health Care / Nikkei 225 | 21hv, 63hv, 126h, 126g |
| Health Care / VIX | 126h |
| Industrials / 10y-3m curve | 21g |
| Industrials / 10-year breakeven inflation | 126h |
| Information Technology / WTI crude oil | 63h |
| Information Technology / Canadian dollar per USD | 126gv |
| Information Technology / 10-year real yield | 21g |
| Information Technology / 10-year Treasury yield | 21g |
| Information Technology / 30-year Treasury yield | 21g |
| Information Technology / Real Estate | 126h |
| Information Technology / Utilities | 126hv |
| Information Technology / 10y-3m curve | 21g |
| Information Technology / 10-year term premium (model) | 21g |
| Materials / Nikkei 225 | 63gv |
| Real Estate / Nikkei 225 | 63hv, 126h |
| Real Estate / 10-year breakeven inflation | 63h, 126h |
| Real Estate / VIX | 126h |
| Utilities / 2-year Treasury yield | 63h |
| Utilities / 3-month Treasury yield | 63h, 63g |
| Oil volatility / Brent crude oil | 126hv |
| Oil volatility / Canadian dollar per USD | 63h, 126h |
| Oil volatility / yen per USD | 21g |
| S&P 500 / WTI crude oil | 63h |
| S&P 500 / 10-year real yield | 21g |
| S&P 500 / 10-year Treasury yield | 21g |
| S&P 500 / 2-year Treasury yield | 21g |
| S&P 500 / 30-year Treasury yield | 21g |
| S&P 500 / Communication Services | 126h |
| S&P 500 / Consumer Staples | 21h, 126h |
| S&P 500 / Energy | 126hv |
| S&P 500 / Financials | 21hv, 126h |
| S&P 500 / Health Care | 126h |
| S&P 500 / Real Estate | 126h |
| S&P 500 / Utilities | 126hv |
| S&P 500 / 10y-3m curve | 21g |
| 10y-2y curve / Nikkei 225 | 21h, 21g, 63g |
| 10y-3m curve / Nikkei 225 | 21h, 21gv |
| 10-year breakeven inflation / Brent crude oil | 21h, 21g |
| 10-year breakeven inflation / Oil volatility | 126hv |
| 10-year term premium (model) / Nikkei 225 | 21g, 63g |
Quarterly leads not confirmed
| Leader → follower | Lag | Found in (to 2020) | Confirmed in 2021–2026 |
|---|---|---|---|
| House prices (BIS), US → Bitcoin | 6 | −0.41 (18) | +0.19 (16) |
| House prices (BIS), IT → Real GDP, EA | 2 | −0.46 (15) | no data |
| Real GDP, DE → Real GDP, IT | 3 | +0.56 (14) | +0.23 (19) |
| US natural gas → Real GDP, IT | 2 | +0.43 (16) | +0.35 (21) |
| House prices (BIS), FR → Real GDP, IT | 4 | +0.46 (16) | no data |
| 10y-2y curve → Real GDP, IT | 1 | −0.67 (16) | −0.20 (22) |
| Real GDP, FR → WTI crude oil | 3 | −0.35 (14) | −0.25 (17) |
| House prices (BIS), FR → real per USD | 1 | +0.52 (18) | no data |
| House prices (BIS), EA → real per USD | 4 | −0.38 (17) | −0.49 (15) |
| Real GDP, FR → won per USD | 3 | +0.61 (14) | +0.29 (17) |
| House prices (BIS), FR → won per USD | 5 | +0.54 (16) | no data |
| House prices (BIS), EA → peso per USD | 5 | +0.42 (16) | −0.35 (14) |
| Real GDP, DE → Swiss franc per USD | 4 | +0.57 (13) | −0.37 (18) |
| Real GDP, FR → Swiss franc per USD | 1 | +0.58 (16) | +0.03 (19) |
| Real GDP, IT → Swiss franc per USD | 1 | +0.59 (15) | +0.02 (22) |
| US federal debt to GDP → Swiss franc per USD | 4 | −0.58 (28) | −0.18 (19) |
| House prices (BIS), EA → Swiss franc per USD | 5 | +0.55 (16) | +0.05 (14) |
| House prices (BIS), EA → USD per Australian dollar | 5 | −0.49 (16) | −0.11 (14) |
| Real GDP, FR → USD per euro | 1 | −0.64 (16) | −0.12 (19) |
| Real GDP, IT → USD per euro | 1 | −0.57 (15) | −0.09 (22) |
| US federal debt to GDP → USD per pound | 4 | +0.35 (28) | +0.22 (19) |
| Real GDP, EA → 10-year Treasury yield | 6 | −0.46 (10) | −0.20 (17) |
| Real GDP, DE → 10-year Treasury yield | 6 | −0.38 (11) | +0.06 (16) |
| Real GDP, FR → 10-year Treasury yield | 3 | −0.46 (14) | +0.40 (17) |
| House prices (BIS), FR → 10-year Treasury yield | 2 | +0.60 (18) | no data |
| Real GDP, DE → 2-year Treasury yield | 6 | −0.30 (11) | +0.26 (16) |
| Real GDP, FR → 2-year Treasury yield | 3 | −0.45 (14) | +0.57 (17) |
| Real GDP, EA → 30-year Treasury yield | 6 | −0.51 (10) | −0.25 (17) |
| Real GDP, DE → 30-year Treasury yield | 6 | −0.39 (11) | −0.05 (16) |
| House prices (BIS), FR → 30-year Treasury yield | 2 | +0.64 (18) | no data |
| US federal debt to GDP → Broad dollar index | 4 | −0.47 (28) | −0.24 (19) |
| 2-year Treasury yield → US real GDP | 1 | +0.18 (115) | −0.22 (23) |
| 3-month Treasury yield → US real GDP | 1 | +0.18 (115) | −0.42 (22) |
| Real GDP, FR → Consumer Staples | 4 | +0.74 (13) | +0.49 (16) |
| US federal debt to GDP → Financials | 3 | +0.36 (29) | +0.21 (20) |
| Real GDP, DE → Health Care | 6 | −0.41 (11) | −0.25 (16) |
| House prices (BIS), EA → Health Care | 5 | −0.55 (16) | −0.15 (14) |
| US federal debt to GDP → Industrials | 3 | +0.40 (29) | +0.01 (20) |
| Real GDP, FR → Real Estate | 5 | −0.42 (12) | −0.07 (15) |
| Real GDP, FR → Nikkei 225 | 3 | −0.49 (14) | −0.18 (17) |
| US federal debt to GDP → Nikkei 225 | 3 | +0.37 (29) | −0.28 (20) |
| Baa credit spread → House prices (BIS), FR | 1 | −0.74 (18) | no data |
| Real GDP, DE → House prices (BIS), FR | 4 | −0.55 (10) | no data |
| Real GDP, IT → House prices (BIS), FR | 2 | −0.43 (11) | no data |
| peso per USD → House prices (BIS), FR | 6 | +0.47 (18) | no data |
| House prices (BIS), IT → House prices (BIS), FR | 3 | −0.51 (15) | no data |
| 5y5y forward inflation → House prices (BIS), FR | 6 | −0.33 (18) | no data |
| Real GDP, DE → House prices (BIS), US | 6 | −0.63 (9) | +0.47 (13) |
| US real GDP → House prices (BIS), US | 5 | −0.38 (22) | −0.29 (15) |
| House prices (BIS), EA → House prices (BIS), US | 5 | −0.59 (14) | +0.15 (11) |
| Ether → House prices (BIS), EA | 2 | +0.43 (13) | +0.07 (19) |
| US real GDP → House prices (BIS), EA | 3 | −0.62 (18) | +0.34 (19) |
| Materials → House prices (BIS), EA | 2 | +0.40 (18) | −0.41 (19) |
| VIX → House prices (BIS), EA | 2 | −0.54 (18) | +0.55 (19) |
| US federal debt to GDP → S&P 500 | 3 | +0.27 (29) | +0.29 (20) |
| House prices (BIS), EA → 10y-2y curve | 3 | −0.49 (18) | −0.13 (16) |
| Real GDP, IT → 10y-3m curve | 2 | −0.60 (14) | −0.17 (21) |
| Real GDP, FR → 10-year breakeven inflation | 3 | −0.41 (14) | −0.36 (17) |
| Real GDP, IT → 10-year breakeven inflation | 6 | −0.31 (10) | +0.19 (17) |
| Real GDP, DE → 5y5y forward inflation | 6 | −0.50 (11) | +0.10 (16) |
| Real GDP, FR → 5y5y forward inflation | 3 | −0.44 (14) | −0.11 (17) |
| Real GDP, IT → 5y5y forward inflation | 6 | −0.49 (10) | +0.33 (17) |
| House prices (BIS), FR → 5y5y forward inflation | 2 | +0.55 (18) | no data |
| Real GDP, FR → 10-year term premium (model) | 3 | −0.55 (14) | +0.09 (17) |
| House prices (BIS), FR → 10-year term premium (model) | 2 | +0.55 (18) | no data |
| House prices (BIS), IT → Economic policy uncertainty (model) | 3 | −0.39 (18) | no data |
Every new relation since 2021
| Pair | Data | 1999–2020 | 2021–23 | 2024–2026 |
|---|---|---|---|---|
| Consumer prices / Core consumer prices | monthly | +0.33 | +0.56 | +0.64 |
| Financial conditions index / Baa credit spread | monthly | +0.72 | +0.47 | +0.57 |
| Consumer sentiment / Financial conditions index | monthly | −0.22 | −0.49 | −0.49 |
| Consumer prices / Core PCE prices | monthly | +0.30 | +0.59 | +0.46 |
| yen per USD / won per USD | daily | +0.03 | +0.18 | +0.45 |
| Real Estate / 10-year real yield | daily | +0.00 | −0.38 | −0.43 |
| Copper / Baa credit spread | monthly | −0.34 | −0.41 | −0.42 |
| Real Estate / 10-year Treasury yield | daily | +0.19 | −0.30 | −0.41 |
| Real Estate / 30-year Treasury yield | daily | +0.18 | −0.25 | −0.40 |
| Real Estate / 10y-3m curve | daily | +0.11 | −0.22 | −0.40 |
| Real Estate / 10-year term premium (model) | daily | +0.18 | −0.30 | −0.39 |
| yen per USD / Canadian dollar per USD | daily | +0.03 | +0.21 | +0.37 |
| Retail sales / Producer prices | monthly | +0.42 | +0.35 | +0.37 |
| yen per USD / USD per Australian dollar | daily | −0.07 | −0.39 | −0.36 |
| Utilities / 10-year real yield | daily | −0.04 | −0.36 | −0.34 |
| Utilities / 10-year Treasury yield | daily | +0.11 | −0.28 | −0.33 |
| Utilities / 10y-3m curve | daily | +0.01 | −0.21 | −0.32 |
| 2-year Treasury yield / Broad dollar index | daily | +0.00 | +0.31 | +0.32 |
| Real Estate / 2-year Treasury yield | daily | +0.21 | −0.22 | −0.31 |
| Utilities / 30-year Treasury yield | daily | +0.10 | −0.24 | −0.31 |
| 10-year Treasury yield / Broad dollar index | daily | −0.08 | +0.32 | +0.30 |
| Utilities / 10-year term premium (model) | daily | +0.08 | −0.28 | −0.29 |
| 10y-2y curve / Baa credit spread | daily | +0.03 | +0.25 | +0.29 |
| 10-year Treasury yield / USD per pound | daily | −0.00 | −0.31 | −0.28 |
| 10-year term premium (model) / Broad dollar index | daily | −0.05 | +0.35 | +0.28 |
| Materials / 10-year real yield | daily | +0.08 | −0.24 | −0.27 |
| Health Care / 10-year real yield | daily | +0.09 | −0.25 | −0.26 |
| Health Care / 30-year Treasury yield | daily | +0.23 | −0.11 | −0.26 |
| Health Care / 10y-3m curve | daily | +0.12 | −0.10 | −0.26 |
| 10-year term premium (model) / USD per pound | daily | −0.01 | −0.33 | −0.25 |
| Consumer Staples / 10-year Treasury yield | daily | +0.19 | −0.13 | −0.25 |
| Health Care / 10-year Treasury yield | daily | +0.24 | −0.18 | −0.25 |
| Health Care / 10-year term premium (model) | daily | +0.21 | −0.19 | −0.24 |
| Consumer Staples / 10y-3m curve | daily | +0.09 | −0.11 | −0.24 |
| 10-year Treasury yield / yuan per USD | daily | −0.00 | +0.24 | +0.24 |
| 30-year Treasury yield / Broad dollar index | daily | −0.13 | +0.23 | +0.24 |
| Consumer Staples / 10-year real yield | daily | +0.07 | −0.21 | −0.24 |
| 10y-3m curve / Broad dollar index | daily | −0.05 | +0.20 | +0.23 |
| Utilities / 2-year Treasury yield | daily | +0.15 | −0.23 | −0.23 |
| 10y-3m curve / USD per pound | daily | +0.01 | −0.21 | −0.22 |
| Consumer Staples / 10-year term premium (model) | daily | +0.16 | −0.15 | −0.22 |
| 10-year term premium (model) / yuan per USD | daily | +0.00 | +0.28 | +0.22 |
| 30-year Treasury yield / USD per euro | daily | −0.03 | −0.21 | −0.22 |
| 2-year Treasury yield / Canadian dollar per USD | daily | −0.05 | +0.18 | +0.22 |
| 2-year Treasury yield / yuan per USD | daily | −0.00 | +0.28 | +0.22 |
| Real Estate / yen per USD | daily | +0.14 | −0.14 | −0.22 |
| 30-year Treasury yield / USD per pound | daily | +0.04 | −0.21 | −0.22 |
| 10y-3m curve / USD per euro | daily | −0.03 | −0.20 | −0.22 |
| 30-year Treasury yield / yuan per USD | daily | −0.01 | +0.18 | +0.21 |
| peso per USD / Ether | daily | −0.07 | −0.14 | −0.21 |
| Nikkei 225 / Ether | daily | +0.08 | +0.15 | +0.21 |
| 2-year Treasury yield / won per USD | daily | −0.05 | +0.18 | +0.20 |
| 10y-3m curve / yuan per USD | daily | −0.01 | +0.12 | +0.19 |
| 10-year Treasury yield / won per USD | daily | −0.09 | +0.17 | +0.19 |
| 10-year term premium (model) / won per USD | daily | −0.08 | +0.22 | +0.19 |
| 10-year term premium (model) / rupee per USD | daily | −0.05 | +0.16 | +0.18 |
| Real Estate / Bitcoin | daily | +0.05 | +0.24 | +0.18 |
| 10-year Treasury yield / USD per Australian dollar | daily | +0.08 | −0.22 | −0.17 |
| Consumer Staples / 2-year Treasury yield | daily | +0.19 | −0.14 | −0.17 |
| Utilities / yen per USD | daily | +0.06 | −0.11 | −0.17 |
| 10-year Treasury yield / Canadian dollar per USD | daily | −0.13 | +0.11 | +0.17 |
| 2-year Treasury yield / USD per Australian dollar | daily | +0.02 | −0.25 | −0.16 |
| 10-year term premium (model) / Canadian dollar per USD | daily | −0.12 | +0.13 | +0.16 |
| 10-year real yield / real per USD | daily | +0.04 | +0.20 | +0.16 |
| 3-month Treasury yield / Broad dollar index | daily | −0.01 | +0.20 | +0.16 |
| Health Care / 2-year Treasury yield | daily | +0.21 | −0.17 | −0.16 |
| Real Estate / Swiss franc per USD | daily | −0.03 | −0.28 | −0.16 |
| 30-year Treasury yield / won per USD | daily | −0.10 | +0.12 | +0.16 |
| USD per Australian dollar / Bitcoin | daily | +0.03 | +0.25 | +0.16 |
| peso per USD / Bitcoin | daily | −0.02 | −0.13 | −0.15 |
| real per USD / Bitcoin | daily | −0.01 | −0.11 | −0.15 |
| 10y-3m curve / rupee per USD | daily | −0.03 | +0.11 | +0.15 |
| Real Estate / Ether | daily | +0.07 | +0.26 | +0.15 |
| 10y-3m curve / USD per Australian dollar | daily | +0.01 | −0.11 | −0.15 |
| 10-year Treasury yield / rupee per USD | daily | −0.07 | +0.13 | +0.15 |
| 10-year term premium (model) / USD per Australian dollar | daily | +0.05 | −0.24 | −0.15 |
| USD per pound / Ether | daily | +0.03 | +0.17 | +0.14 |
| 3-month Treasury yield / USD per pound | daily | −0.01 | −0.17 | −0.14 |
| S&P 500 / 10-year real yield | daily | +0.11 | −0.27 | −0.14 |
| Industrials / 10-year real yield | daily | +0.11 | −0.22 | −0.14 |
| 30-year Treasury yield / rupee per USD | daily | −0.09 | +0.08 | +0.13 |
| Consumer Staples / Swiss franc per USD | daily | +0.01 | −0.14 | −0.13 |
| 30-year Treasury yield / USD per Australian dollar | daily | +0.11 | −0.13 | −0.13 |
| Utilities / Bitcoin | daily | +0.03 | +0.16 | +0.12 |
| yen per USD / real per USD | daily | −0.07 | +0.16 | +0.12 |
| Broad dollar index / Bitcoin | daily | −0.03 | −0.22 | −0.12 |
| 3-month Treasury yield / yuan per USD | daily | +0.01 | +0.21 | +0.12 |
| USD per pound / Bitcoin | daily | +0.01 | +0.19 | +0.11 |
| 2-year Treasury yield / rupee per USD | daily | −0.04 | +0.12 | +0.11 |
| yen per USD / rupee per USD | daily | −0.02 | +0.18 | +0.11 |
| Utilities / Ether | daily | +0.05 | +0.18 | +0.10 |
| Consumer Discretionary / 10-year real yield | daily | +0.08 | −0.26 | −0.10 |
| won per USD / Bitcoin | daily | −0.00 | −0.13 | −0.10 |
| Canadian dollar per USD / Bitcoin | daily | −0.05 | −0.24 | −0.09 |
Every notable 12-month change
| Relation | Lag | 12 months ago | Now | Change | Pct. |
|---|---|---|---|---|---|
| Energy → Nikkei 225 | 1 | +0.42 | −0.06 | −0.48 | 0.0 |
| Health Care → Nikkei 225 | 1 | +0.36 | −0.04 | −0.39 | 1.0 |
| Communication Services → Nikkei 225 | 1 | +0.53 | +0.17 | −0.36 | 1.3 |
| Consumer Staples → Nikkei 225 | 1 | +0.21 | −0.12 | −0.34 | 4.3 |
| Energy → USD per Australian dollar | 1 | +0.36 | +0.03 | −0.33 | 1.3 |
| Materials → USD per Australian dollar | 1 | +0.41 | +0.10 | −0.32 | 0.3 |
| Consumer Discretionary → USD per Australian dollar | 1 | +0.41 | +0.10 | −0.31 | 0.3 |
| Industrials → USD per Australian dollar | 1 | +0.46 | +0.15 | −0.31 | 1.0 |
| Real Estate → Nikkei 225 | 1 | +0.32 | +0.03 | −0.29 | 4.0 |
| Information Technology → USD per Australian dollar | 1 | +0.43 | +0.15 | −0.28 | 2.3 |
| Financials → Nikkei 225 | 1 | +0.46 | +0.20 | −0.26 | 3.0 |
| S&P 500 → USD per Australian dollar | 1 | +0.45 | +0.20 | −0.25 | 2.3 |
| 10-year breakeven inflation → Nikkei 225 | 1 | +0.20 | −0.05 | −0.25 | 3.8 |
| Industrials → Nikkei 225 | 1 | +0.54 | +0.30 | −0.24 | 3.0 |
| VIX → peso per USD | 1 | +0.26 | +0.03 | −0.23 | 0.0 |
| Materials → USD per pound | 1 | +0.23 | +0.02 | −0.22 | 2.0 |
| VIX → won per USD | 1 | +0.11 | −0.11 | −0.22 | 1.4 |
| Industrials → USD per pound | 1 | +0.27 | +0.06 | −0.21 | 2.0 |
| Consumer Discretionary → Nikkei 225 | 1 | +0.48 | +0.27 | −0.21 | 3.0 |
| Energy → USD per pound | 1 | +0.16 | −0.05 | −0.21 | 4.3 |
| S&P 500 → rupee per USD | 1 | −0.08 | −0.28 | −0.20 | 2.3 |
| Information Technology → rupee per USD | 1 | −0.02 | −0.18 | −0.16 | 2.7 |
| Health Care → rupee per USD | 1 | −0.07 | −0.22 | −0.15 | 3.7 |
| Real Estate → real per USD | 1 | −0.18 | −0.00 | +0.17 | 95.7 |
| Financials → real per USD | 1 | −0.22 | −0.05 | +0.18 | 95.7 |
| Consumer Discretionary → real per USD | 1 | −0.25 | −0.07 | +0.19 | 97.7 |
| Information Technology → won per USD | 1 | −0.17 | +0.03 | +0.19 | 97.7 |
| Information Technology → real per USD | 1 | −0.22 | −0.02 | +0.20 | 95.0 |
| rupee per USD → won per USD | 1 | −0.14 | +0.06 | +0.20 | 95.0 |
| Energy → real per USD | 1 | −0.24 | −0.04 | +0.20 | 98.3 |
| S&P 500 → real per USD | 1 | −0.25 | −0.04 | +0.22 | 97.7 |
| Materials → peso per USD | 1 | −0.28 | −0.04 | +0.24 | 98.3 |
| VIX → USD per Australian dollar | 1 | −0.36 | −0.11 | +0.25 | 100.0 |
| Materials → 10-year breakeven inflation | 1 | −0.09 | +0.16 | +0.25 | 96.9 |
| 10-year real yield → Swiss franc per USD | 1 | −0.12 | +0.14 | +0.26 | 99.2 |
| Materials → real per USD | 1 | −0.29 | −0.02 | +0.27 | 99.7 |
| Energy → peso per USD | 1 | −0.25 | +0.03 | +0.28 | 98.0 |
| Industrials → real per USD | 1 | −0.28 | −0.01 | +0.28 | 100.0 |
This document is published by Gyre Holdings LLC d/b/a Gyre Research for informational purposes only and does not constitute investment advice or a solicitation to buy or sell any security. Readers should consult a qualified financial professional before making any investment decision. It is licensed under CC BY 4.0: you may share and adapt it with attribution to Gyre Research.
Contact: team@gyreresearch.com
About Gyre Research
What we do
Gyre Research develops and supports the Gyre Investment Analytics Hub: performance, risk, compliance, reconciliation and more on one calculation engine, with every number traceable to the transaction behind it and answerable in plain English, for portfolio managers and analysts at hedge funds, family offices, RIAs and institutional managers, and the operations teams that support them. Free research tools at gyreresearch.com.
What the Hub covers
- Data
- Institutional-grade reference layer powering every other module.
- AI Assistant
- Plain-language questions, answered from your own portfolio data.
- Portfolio Management
- Operational spine of running a book.
- Portfolio Construction
- Build and rebalance workflow.
- Back Testing
- Historical simulation workbench.
- Performance
- Institutional-grade return calculation.
- Risk
- Multi-factor, multi-dimensional risk analytics.
- Compliance
- Audit-ready rule engine.
- Reconciliation
- AI-native back-office automation.
- Portfolio Accounting
- Institutional books of record (coming in 2027).
- Tax
- Enterprise-grade tax-lot engine (coming in 2027).
How we differ
One calculation engine across performance, risk, compliance and reconciliation; every number clickable down to the trade; plain-language questions answered with the rows behind them; institutional methods (GIPS returns, covariance shrinkage, wash-sale tracking).
Work with Gyre
The Gyre Investment Analytics Hub is inexpensive and sits on top of your current OMS, EMS and accounting systems, dramatically enhancing decision support and analysis. Gyre also provides custom analytics to meet any proprietary need. Contact us today: team@gyreresearch.com
team@gyreresearch.comSubscribe free
Each new issue by email: its In brief and a link to the paper. Choose the Quarterly, the Monthly, or both.
All issues of Markets and Macro · Markets and Macro Quarterly, October 2026 (PDF)